
Seller's Agent in 2025
Ivellies Wilson
RE/MAX
(404) 713-3373
8 in this area
49 Total Sales
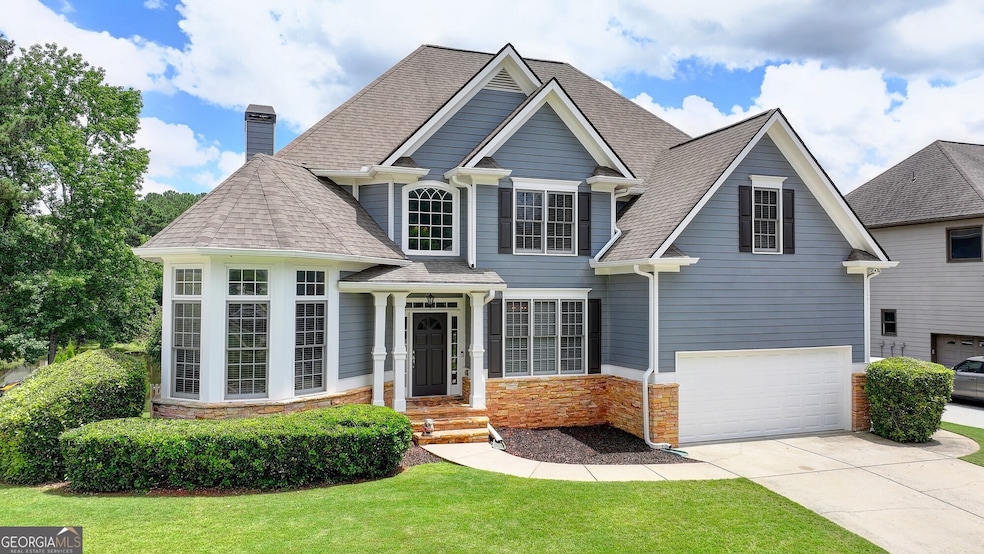
Dreamy Lake Views & Resort-Style Living the in Hamilton Mill School District! Imagine ending each day watching a breathtaking sunset over the peaceful community lake from the comfort of your own screened back deck! Welcome to 2875 Daniel Park Run, a stunning 6-bedroom, 5-bath home offering 3,682 sq. ft. of beautifully designed living space in one of the most desirable neighborhoods in North Gwinnett. Step inside and you'll be welcomed by soaring vaulted ceilings in the living room, gorgeous hardwood flooring setting the tone for this spacious and elegant home. The formal dining room with beautiful coffered ceilings easily sits eight and is perfect for hosting holiday dinners or family gatherings. The open-concept kitchen features quartz countertops, custom cabinetry, stainless steel appliances and even lake views while you cook! The kitchen seamlessly flows into a large family room featuring a cozy fireplace, custom built-in bookcases, and a charming bay window overlooking the water. Downstairs also includes a guest bedroom with a full bath, ideal for visitors or a home office setup. Upstairs, the spacious primary suite features a walk-in closet, a spa-like bath with a jetted tub, dual vanities, and ample space to unwind. You'll also find two additional bedrooms sharing a full bath, and a fourth upstairs bedroom with its own private bathroom, perfect for teens, in-laws, or guests. But there's more! The fully finished basement is the ultimate entertainment zone with a movie/media room, custom bar area, versatile bedroom/gym/office space, full bathroom, and direct access to the fenced backyard with panoramic lake views. This comes with lots of storage space including an additional storage space with outside access. Daniel Park subdivision offers resort style amenities, including: Swimming pool & children's mushroom splash fountain, lighted tennis/pickleball courts, playground, open green space & covered pavilions, Community Lake & fishing, swim & tennis teams for kids and adults. All conveniently located minutes from I-85, the Mall of Georgia, Chateau Elan Winery & Golf, Little Mulberry Park, shopping, dining, and more! 2875 Daniel Park Run is more than a home, it's a lifestyle. Don't miss your chance to live lakefront in a community that truly has it all.
| Date | Type | Sale Price | Title Company |
|---|---|---|---|
| Limited Warranty Deed | $690,000 | -- | |
| Deed | $369,900 | -- | |
| Deed | $272,800 | -- |
| Date | Status | Loan Amount | Loan Type |
|---|---|---|---|
| Open | $552,000 | New Conventional | |
| Previous Owner | $73,980 | Unknown | |
| Previous Owner | $295,920 | New Conventional | |
| Previous Owner | $218,240 | New Conventional |
| Date | Event | Price | List to Sale | Price per Sq Ft |
|---|---|---|---|---|
| 08/15/2025 08/15/25 | Sold | $690,000 | +0.1% | $187 / Sq Ft |
| 07/15/2025 07/15/25 | Pending | -- | -- | -- |
| 06/27/2025 06/27/25 | For Sale | $689,000 | -- | $187 / Sq Ft |
| Year | Tax Paid | Tax Assessment Tax Assessment Total Assessment is a certain percentage of the fair market value that is determined by local assessors to be the total taxable value of land and additions on the property. | Land | Improvement |
|---|---|---|---|---|
| 2025 | $6,258 | $217,240 | $44,000 | $173,240 |
| 2024 | $6,337 | $213,400 | $47,200 | $166,200 |
| 2023 | $6,337 | $201,880 | $47,200 | $154,680 |
| 2022 | $5,531 | $175,760 | $41,200 | $134,560 |
| 2021 | $4,630 | $129,680 | $29,400 | $100,280 |
| 2020 | $4,660 | $129,680 | $29,400 | $100,280 |
| 2019 | $4,503 | $129,680 | $29,400 | $100,280 |
| 2018 | $4,341 | $121,880 | $25,920 | $95,960 |
| 2016 | $3,912 | $107,560 | $21,600 | $85,960 |
| 2015 | $3,537 | $95,800 | $20,000 | $75,800 |
| 2014 | $3,465 | $93,240 | $20,000 | $73,240 |
Seller's Agent in 2025
Ivellies Wilson
RE/MAX
(404) 713-3373
8 in this area
49 Total Sales
Buyer's Agent in 2025
Miranda Gill
Virtual Properties Realty.com
(404) 301-7679
3 in this area
80 Total Sales
Source: Georgia MLS
MLS Number: 10549219
APN: 3-001D-103
Disclaimer: Certain information contained herein is derived from information provided by parties other than Homes.com. All information provided is deemed reliable, but is not guaranteed to be accurate and should be independently verified.
![]() The data relating to real estate for sale on this web site comes in part from the Broker Reciprocity Program of Georgia MLS. Real estate listings held by brokerage firms other than Redfin are marked with the Broker Reciprocity logo and detailed information about them includes the name of the listing brokers. Information deemed reliable but not guaranteed. Copyright 2025 Georgia MLS. All rights reserved.
The data relating to real estate for sale on this web site comes in part from the Broker Reciprocity Program of Georgia MLS. Real estate listings held by brokerage firms other than Redfin are marked with the Broker Reciprocity logo and detailed information about them includes the name of the listing brokers. Information deemed reliable but not guaranteed. Copyright 2025 Georgia MLS. All rights reserved.