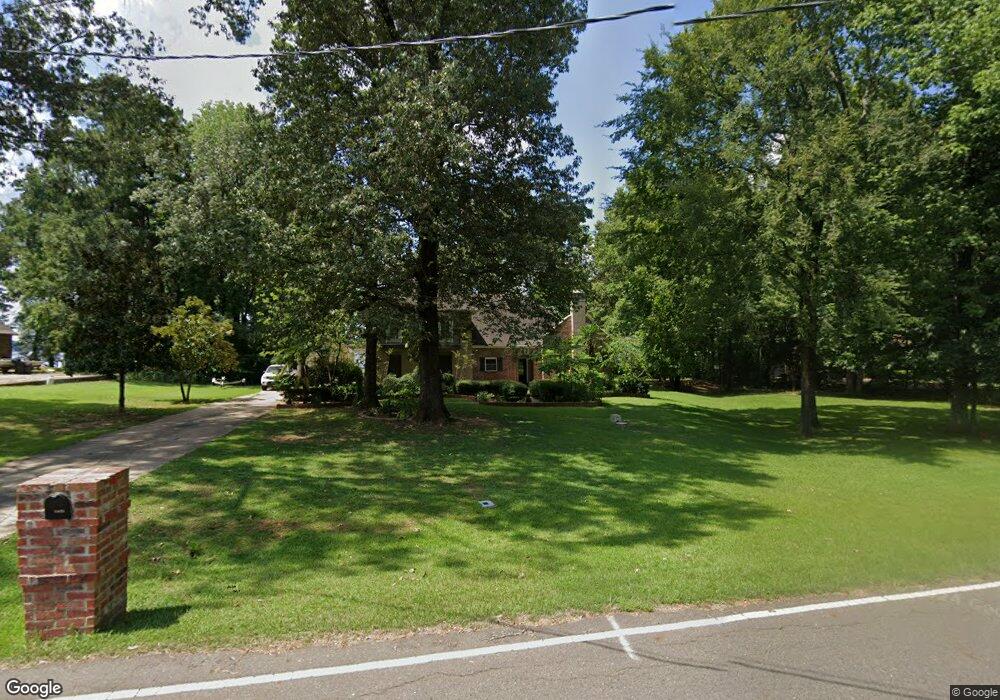
2875 E Linton Rd Benton, LA 71006
Linton-Midway NeighborhoodEstimated Value: $464,000 - $596,000
Studio
--
Bath
2,282
Sq Ft
$238/Sq Ft
Est. Value
About This Home
This home is located at 2875 E Linton Rd, Benton, LA 71006 and is currently estimated at $544,028, approximately $238 per square foot. 2875 E Linton Rd is a home located in Bossier Parish with nearby schools including Benton Elementary School, Benton Middle School, and Benton High School.
Ownership History
Date
Name
Owned For
Owner Type
Purchase Details
Closed on
Jun 27, 2014
Sold by
Lfh Invesments L L C
Bought by
Moore Christopher L and Moore Jennifer H
Current Estimated Value
Home Financials for this Owner
Home Financials are based on the most recent Mortgage that was taken out on this home.
Original Mortgage
$379,905
Outstanding Balance
$290,132
Interest Rate
4.23%
Mortgage Type
Unknown
Estimated Equity
$253,896
Purchase Details
Closed on
Feb 23, 2012
Sold by
Bowen Joseph Bruce and Bowen Michelle Pitkin
Bought by
Lfh Investments Llc
Purchase Details
Closed on
Oct 16, 2008
Sold by
Blindu Maureen Ann
Bought by
Bowen Joseph Bruce and Bowen Michelle Pitkin
Purchase Details
Closed on
Jun 1, 2007
Sold by
Sonnier Tom Joseph and Sonnier Linda Litton
Bought by
Blindu Maureen Ann
Home Financials for this Owner
Home Financials are based on the most recent Mortgage that was taken out on this home.
Original Mortgage
$260,000
Interest Rate
6.17%
Mortgage Type
Unknown
Create a Home Valuation Report for This Property
The Home Valuation Report is an in-depth analysis detailing your home's value as well as a comparison with similar homes in the area
Home Values in the Area
Average Home Value in this Area
Purchase History
| Date | Buyer | Sale Price | Title Company |
|---|---|---|---|
| Moore Christopher L | $399,900 | Multiple | |
| Lfh Investments Llc | -- | None Available | |
| Bowen Joseph Bruce | $370,000 | None Available | |
| Blindu Maureen Ann | $325,000 | None Available |
Source: Public Records
Mortgage History
| Date | Status | Borrower | Loan Amount |
|---|---|---|---|
| Open | Moore Christopher L | $379,905 | |
| Previous Owner | Blindu Maureen Ann | $260,000 |
Source: Public Records
Tax History
| Year | Tax Paid | Tax Assessment Tax Assessment Total Assessment is a certain percentage of the fair market value that is determined by local assessors to be the total taxable value of land and additions on the property. | Land | Improvement |
|---|---|---|---|---|
| 2024 | $4,130 | $41,700 | $12,000 | $29,700 |
| 2023 | $3,755 | $36,798 | $12,000 | $24,798 |
| 2022 | $3,736 | $36,798 | $12,000 | $24,798 |
| 2021 | $3,677 | $36,798 | $12,000 | $24,798 |
| 2020 | $3,677 | $36,798 | $12,000 | $24,798 |
| 2019 | $3,733 | $36,891 | $12,000 | $24,891 |
| 2018 | $3,733 | $36,890 | $12,000 | $24,890 |
| 2017 | $3,691 | $36,890 | $12,000 | $24,890 |
| 2016 | $3,691 | $36,890 | $12,000 | $24,890 |
| 2015 | $2,805 | $31,110 | $9,000 | $22,110 |
| 2014 | $2,801 | $31,110 | $9,000 | $22,110 |
Source: Public Records
Map
Nearby Homes
- 135 Oak Leaf Trail
- 0 E Linton Rd Unit 278086NL
- 947 Judy Ln
- 400 Crouch Rd
- 0 Vos Rd
- 129 Running Deer Ln
- 0 Crouch Rd Unit 4 20967077
- 0 Crouch Rd Unit 2 20966992
- 0 Crouch Rd Unit 3 20967036
- 155 Jones Ln
- 113 Cypress Lake Cir
- 5296 Linton Cutoff Rd
- 1060 Highway 162
- 0 Downs Dr
- 5180 Linton Cutoff Rd
- 0 Clement Rd
- 342 Butler Hill Rd
- 115 Barnes Dr
- 5107 Waters Edge Dr
- 920 Butler Hill Rd
- 2867 E Linton Rd
- 2885 E Linton Rd
- 2884 E Linton Rd
- 2888 E Linton Rd
- 2859 E Linton Rd
- 2870 E Linton Rd
- 2891 E Linton Rd
- 2898 E Linton Rd
- 2864 E Linton Rd
- 2903 E Linton Rd
- Lot 8 E Linton Rd
- 2835 E Linton Rd
- 2910 E Linton Rd Unit 27
- 2910 E Linton Rd
- 2930 E Linton Rd
- 2840 E Linton Rd
- 2909 E Linton Rd
- 2830 E Linton Rd
- 2821 E Linton Rd
- 2820 E Linton Rd
Your Personal Tour Guide
Ask me questions while you tour the home.