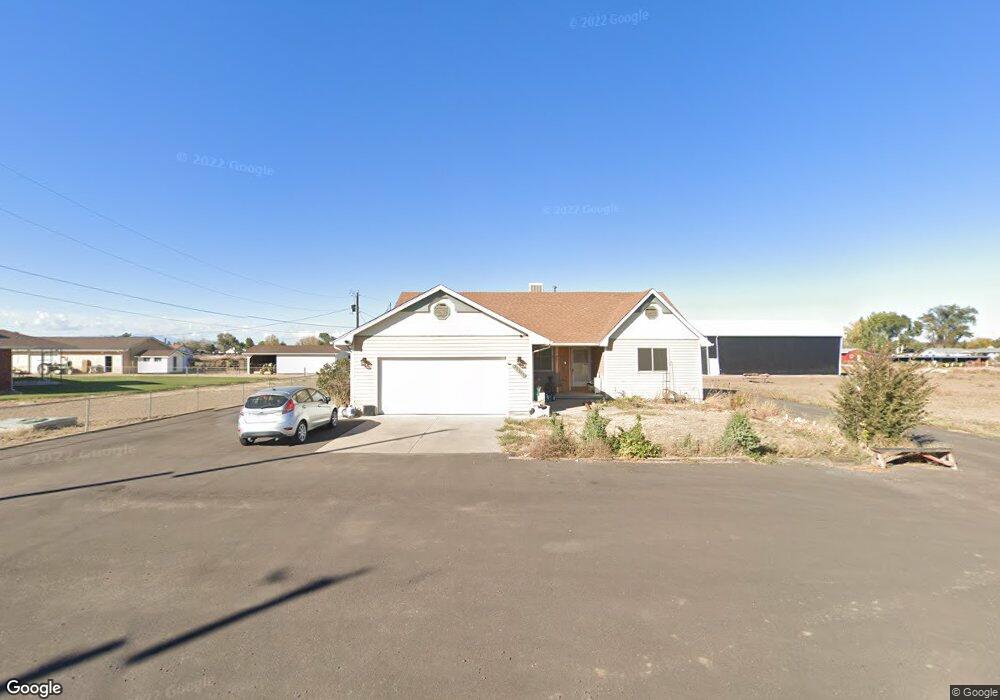
28757 Iris Rd Pueblo, CO 81006
Estimated Value: $443,000 - $576,000
3
Beds
2
Baths
1,605
Sq Ft
$315/Sq Ft
Est. Value
About This Home
This home is located at 28757 Iris Rd, Pueblo, CO 81006 and is currently estimated at $506,078, approximately $315 per square foot. 28757 Iris Rd is a home located in Pueblo County with nearby schools including Vineland Elementary School, Vineland Middle School, and Pueblo County High School.
Ownership History
Date
Name
Owned For
Owner Type
Purchase Details
Closed on
Apr 18, 2016
Sold by
Payne Ronald C and Payne Rose M
Bought by
Latka Rhonda P
Current Estimated Value
Home Financials for this Owner
Home Financials are based on the most recent Mortgage that was taken out on this home.
Original Mortgage
$54,293
Outstanding Balance
$3,744
Interest Rate
3.68%
Mortgage Type
New Conventional
Estimated Equity
$502,334
Purchase Details
Closed on
Nov 13, 2009
Sold by
Payne Ronald C and Payne Rose M
Bought by
Payne Ronald C and Payne Rose M
Home Financials for this Owner
Home Financials are based on the most recent Mortgage that was taken out on this home.
Original Mortgage
$78,500
Interest Rate
4.38%
Mortgage Type
New Conventional
Purchase Details
Closed on
Jun 11, 1971
Sold by
Rodasta Anthony J + Jennie L
Bought by
Payne Ronald C + Rose M
Create a Home Valuation Report for This Property
The Home Valuation Report is an in-depth analysis detailing your home's value as well as a comparison with similar homes in the area
Home Values in the Area
Average Home Value in this Area
Purchase History
| Date | Buyer | Sale Price | Title Company |
|---|---|---|---|
| Latka Rhonda P | -- | Land Title Guarantee Company | |
| Payne Ronald C | -- | Htco | |
| Payne Ronald C + Rose M | $3,000 | -- | |
| Rodasta Anthony J + Jennie L | -- | -- |
Source: Public Records
Mortgage History
| Date | Status | Borrower | Loan Amount |
|---|---|---|---|
| Open | Latka Rhonda P | $54,293 | |
| Previous Owner | Payne Ronald C | $78,500 |
Source: Public Records
Tax History Compared to Growth
Tax History
| Year | Tax Paid | Tax Assessment Tax Assessment Total Assessment is a certain percentage of the fair market value that is determined by local assessors to be the total taxable value of land and additions on the property. | Land | Improvement |
|---|---|---|---|---|
| 2024 | $3,252 | $30,800 | -- | -- |
| 2023 | $3,288 | $34,490 | $6,790 | $27,700 |
| 2022 | $2,364 | $22,450 | $760 | $21,690 |
| 2021 | $2,454 | $22,950 | $830 | $22,120 |
| 2020 | $2,369 | $18,360 | $870 | $17,490 |
| 2019 | $2,324 | $15,699 | $865 | $14,834 |
| 2018 | $2,166 | $20,595 | $1,186 | $19,409 |
| 2017 | $2,218 | $20,595 | $1,186 | $19,409 |
| 2016 | $2,235 | $20,700 | $1,036 | $19,664 |
| 2015 | $2,221 | $20,700 | $1,036 | $19,664 |
| 2014 | $2,058 | $19,190 | $841 | $18,349 |
Source: Public Records
Map
Nearby Homes
- 28513 Hillside Rd
- 1339 28th Ln
- TBD Hillside Rd
- 27875 County Farm Rd
- 28421 E US Highway 50
- 1145 Wago Dr
- 1419 27 1 2 Ln
- 1470 Villa Spanada St
- 29767 Preston Rd
- 27810 Spaccamonti Ct
- 1040 28th Ln
- 27193 County Farm Rd
- 29380 Windrow Dr
- 945 29th Ln
- TBD 27th Ln
- 27111 Preston Rd
- 28922 Everett Rd
- Lot C Manning Rd
- Lot C Manning Rd
- 760 28 1 2 Ln