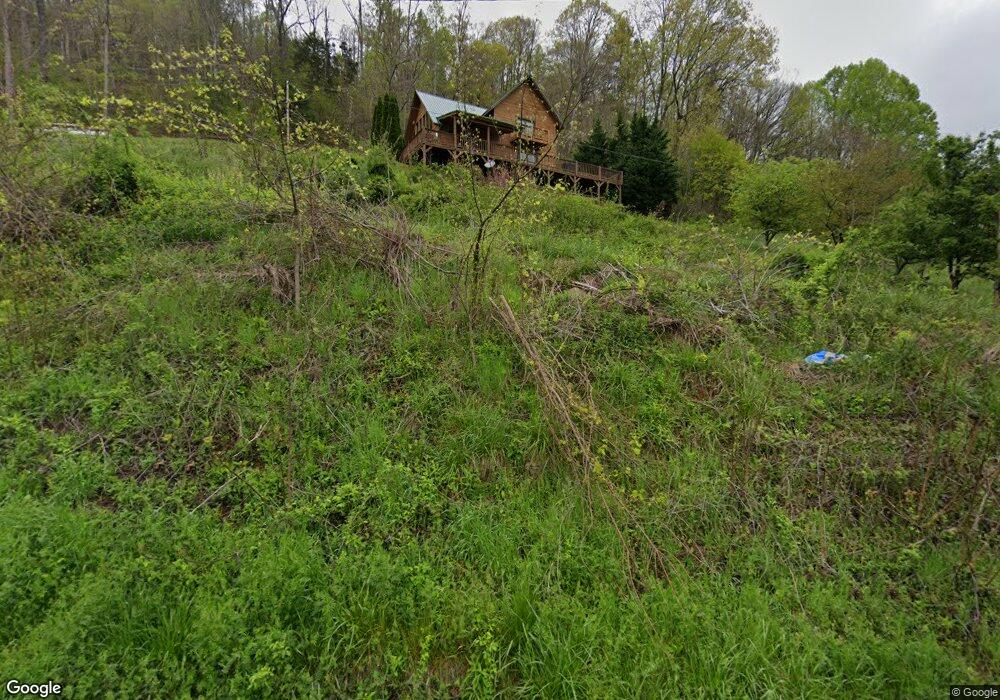
2876 Draft Rd Butler, TN 37640
Estimated Value: $183,000 - $427,000
3
Beds
2
Baths
1,584
Sq Ft
$214/Sq Ft
Est. Value
About This Home
This home is located at 2876 Draft Rd, Butler, TN 37640 and is currently estimated at $339,754, approximately $214 per square foot. 2876 Draft Rd is a home located in Johnson County with nearby schools including Johnson County Middle School and Johnson County High School.
Ownership History
Date
Name
Owned For
Owner Type
Purchase Details
Closed on
May 28, 2019
Sold by
Dream Estates Llc
Bought by
Vanveldhuizen Mark Anthony and Vanveldhuizen Julie Renee
Current Estimated Value
Home Financials for this Owner
Home Financials are based on the most recent Mortgage that was taken out on this home.
Original Mortgage
$241,000
Outstanding Balance
$211,898
Interest Rate
4.1%
Mortgage Type
New Conventional
Estimated Equity
$127,856
Purchase Details
Closed on
Oct 25, 2007
Sold by
Brian Boesen
Bought by
Layne Christine A
Purchase Details
Closed on
Sep 10, 2007
Sold by
John Thrasher William
Bought by
Wayne Butler
Purchase Details
Closed on
Jul 1, 2005
Sold by
Not Provided
Bought by
Dream Estates Llc
Purchase Details
Closed on
Sep 15, 2004
Bought by
Clemons Marc A and Clemons Leann K
Purchase Details
Closed on
Sep 10, 2002
Bought by
Curtis Kenneth A and Allison Curtis E
Purchase Details
Closed on
Jun 24, 1996
Bought by
Trivette Larry M and Trivette Tina K
Create a Home Valuation Report for This Property
The Home Valuation Report is an in-depth analysis detailing your home's value as well as a comparison with similar homes in the area
Home Values in the Area
Average Home Value in this Area
Purchase History
| Date | Buyer | Sale Price | Title Company |
|---|---|---|---|
| Vanveldhuizen Mark Anthony | $240,368 | Walker Title Llc | |
| Layne Christine A | $12,500 | -- | |
| Wayne Butler | -- | -- | |
| Dream Estates Llc | -- | -- | |
| Clemons Marc A | $250,000 | -- | |
| Curtis Kenneth A | $247,000 | -- | |
| Trivette Larry M | $20,700 | -- |
Source: Public Records
Mortgage History
| Date | Status | Borrower | Loan Amount |
|---|---|---|---|
| Open | Vanveldhuizen Mark Anthony | $241,000 |
Source: Public Records
Tax History Compared to Growth
Tax History
| Year | Tax Paid | Tax Assessment Tax Assessment Total Assessment is a certain percentage of the fair market value that is determined by local assessors to be the total taxable value of land and additions on the property. | Land | Improvement |
|---|---|---|---|---|
| 2024 | $1,097 | $49,650 | $12,050 | $37,600 |
| 2023 | $1,097 | $49,650 | $12,050 | $37,600 |
| 2022 | $899 | $49,650 | $12,050 | $37,600 |
| 2021 | $899 | $49,650 | $12,050 | $37,600 |
| 2020 | $952 | $49,650 | $12,050 | $37,600 |
| 2019 | $952 | $46,425 | $14,475 | $31,950 |
| 2018 | $952 | $46,425 | $14,475 | $31,950 |
| 2017 | $952 | $46,425 | $14,475 | $31,950 |
| 2016 | $952 | $46,425 | $14,475 | $31,950 |
| 2015 | $840 | $46,425 | $14,475 | $31,950 |
| 2014 | $886 | $48,925 | $14,475 | $34,450 |
Source: Public Records
Map
Nearby Homes
- 375 Lake Cabin Ln
- Lot 32 Lakeridge Dr
- Lot 31 Lakeridge Dr
- Lot 30 Lakeridge Dr
- Lot 21 Lakeridge Dr
- Lot 20 Lakeridge Dr
- Lot 18 Lakeridge Dr
- Lot 17 Lakeridge Dr
- Lot 13 Lakeridge Dr
- Lot 12 Lakeridge Dr
- Lot 11 Lakeridge Dr
- Lot 5 Lakeridge Dr
- Lot 2 Lakeridge Dr
- Lot 33 Lakeridge Dr
- Lot 10 Lakeridge Dr
- Lot 1 Lakeridge Dr
- 139 Lakeridge Dr
- Lot 8 High Country Rd Pvt Rd
- 0 Cowan Town Rd Unit 23873988
- Lot 17 Cowan Town Rd
- 2886 Draft Rd
- 2860 Draft Rd
- 397 Cabin Ln
- 410 Lake Cabin Ln
- 2732 Draft Rd
- 2842 Draft Rd
- 179 Lake Cabin Ln
- 397 Lake Cabin Ln
- 205 Draft Rd
- 130 Lake Cabin Ln
- 2702 Draft Rd
- 341 Lake Cabin Ln
- 130 Lake Cabin Dr
- 1 Draft Rd
- 2905 Draft Rd
- 2984 Draft Rd
- 200 Lake Cabin Ln
- 220 Lake Cabin Ln
- 410 Hickory Hill Ln
- Lot 28 Lake Ridge Subdivision