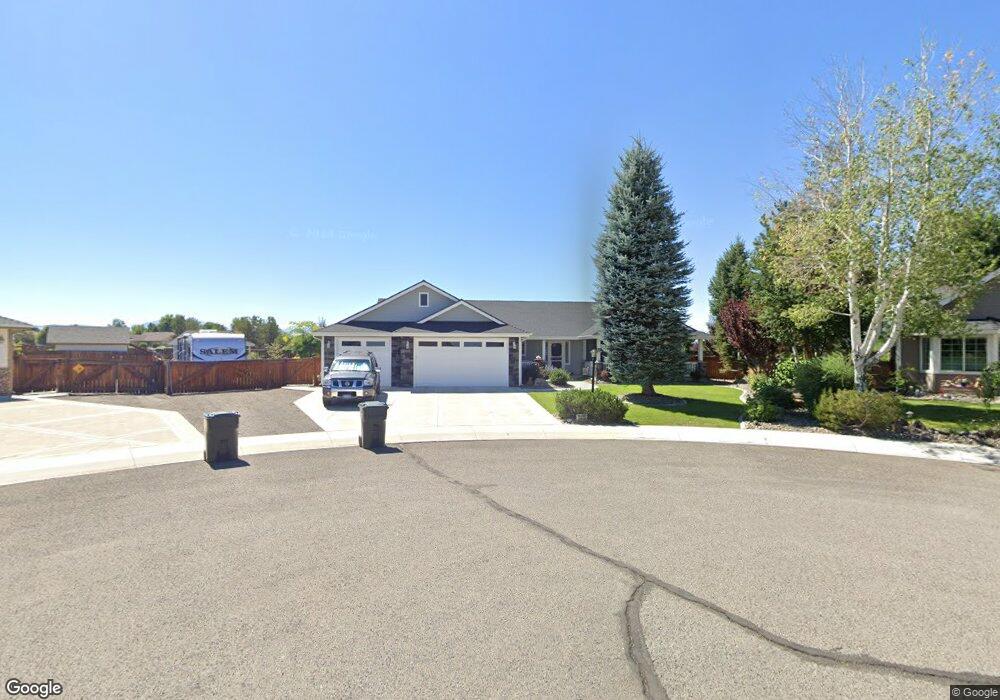
2878 San Jose Ct Minden, NV 89423
Estimated Value: $801,997 - $867,000
3
Beds
2
Baths
2,013
Sq Ft
$417/Sq Ft
Est. Value
About This Home
This home is located at 2878 San Jose Ct, Minden, NV 89423 and is currently estimated at $839,749, approximately $417 per square foot. 2878 San Jose Ct is a home located in Douglas County with nearby schools including Pinon Hills Elementary School, Carson Valley Middle School, and Douglas County High School.
Ownership History
Date
Name
Owned For
Owner Type
Purchase Details
Closed on
Dec 6, 2023
Sold by
Dennis L And Patricia L Van Der Sluis 20
Bought by
Dennis Lee Van Der Sluis and Dennis Patricia Louise
Current Estimated Value
Purchase Details
Closed on
Oct 22, 2021
Sold by
Vandersluis Dennis L and Vandersluis Van Dersluis
Bought by
Vander Sluis Dennis L and Vander Van Der
Purchase Details
Closed on
May 30, 2012
Sold by
Dennis L & Patricia L Van Der Sluis 2007
Bought by
Dennis L Patricia L Van Der Sluis 2012 J
Purchase Details
Closed on
Dec 12, 2007
Sold by
Vander Sluis Dennis and Van Der Sluis Patricia
Bought by
Dennis L & Patricia L Van Der Sluis 2007
Purchase Details
Closed on
Feb 4, 2006
Sold by
Nichols William W and Nichols Sandra L
Bought by
Vander Sluis Dennis and Van Der Sluis Patricia
Create a Home Valuation Report for This Property
The Home Valuation Report is an in-depth analysis detailing your home's value as well as a comparison with similar homes in the area
Home Values in the Area
Average Home Value in this Area
Purchase History
| Date | Buyer | Sale Price | Title Company |
|---|---|---|---|
| Dennis Lee Van Der Sluis | -- | None Listed On Document | |
| Vander Sluis Dennis L | -- | None Available | |
| Dennis L Patricia L Van Der Sluis 2012 J | -- | None Available | |
| Dennis L & Patricia L Van Der Sluis 2007 | -- | None Available | |
| Vander Sluis Dennis | $200,000 | Stewart Title Of Douglas |
Source: Public Records
Tax History Compared to Growth
Tax History
| Year | Tax Paid | Tax Assessment Tax Assessment Total Assessment is a certain percentage of the fair market value that is determined by local assessors to be the total taxable value of land and additions on the property. | Land | Improvement |
|---|---|---|---|---|
| 2025 | $3,611 | $172,168 | $61,250 | $110,918 |
| 2024 | $3,611 | $172,739 | $61,250 | $111,489 |
| 2023 | $3,505 | $165,811 | $61,250 | $104,561 |
| 2022 | $3,403 | $151,132 | $52,500 | $98,632 |
| 2021 | $3,304 | $140,888 | $47,250 | $93,638 |
| 2020 | $3,208 | $135,993 | $43,750 | $92,243 |
| 2019 | $3,114 | $129,003 | $38,500 | $90,503 |
| 2018 | $3,024 | $118,525 | $31,500 | $87,025 |
| 2017 | $2,936 | $112,305 | $24,500 | $87,805 |
| 2016 | $2,861 | $105,265 | $17,500 | $87,765 |
| 2015 | $2,856 | $105,265 | $17,500 | $87,765 |
| 2014 | $2,772 | $100,084 | $17,500 | $82,584 |
Source: Public Records
Map
Nearby Homes
- 2885 Rio Vista Dr Unit 6
- 2937 La Cresta Cir
- 2895 San Juan Cir
- 2958 Del Rio Ln
- 2882 La Cresta Cir
- 2979 Del Rio Ln
- 2862 Sierra Mesa Ct
- 2951 Santa Inez Dr
- 1367 Porter Dr
- 1336 Santa Cruz Dr
- 1299 Melborn Way
- 1356 Stephanie Way
- 1354 Stephanie Way
- 1286 Currycomb Cir
- 2775 Vicky Ln
- 1124 N Fork Trail
- 1290 Saddlehorn Ct
- 2703 Stirrup Ct
- 2687 Wildhorse Ln
- 1358 Downs Dr
- 2882 San Jose Ct
- 2881 San Jose Ct
- 2885 San Jose Ct
- 2886 San Jose Ct
- 2889 San Jose Ct
- 2890 San Jose Ct
- 2893 San Jose Ct
- 1273 Hermosa Ct
- 2897 San Jose Ct
- 1272 Hermosa Ct
- 1277 Hermosa Ct
- 1271 Siesta Ct
- 2889 Rio Vista Dr
- 1276 Hermosa Ct
- 2881 Rio Vista Dr
- 2893 Rio Vista Dr
- 2877 Rio Vista Dr
- 1277 Santa fe Ct
- 1273 Santa fe Ct
- 2897 Rio Vista Dr