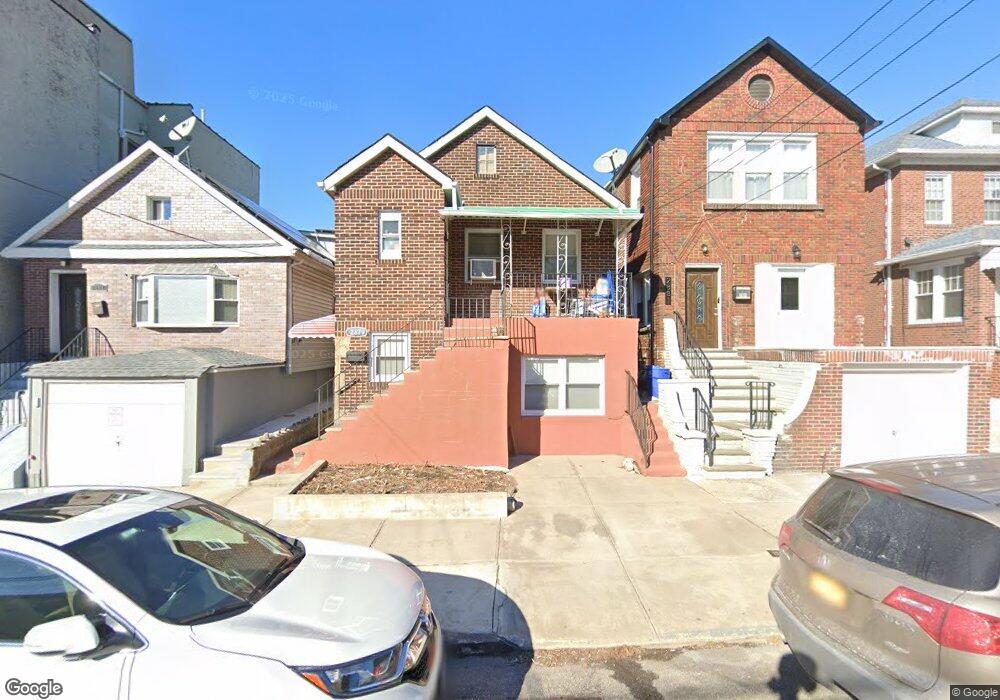
2879 Roberts Ave Bronx, NY 10461
Middletown-Pelham Bay NeighborhoodEstimated Value: $847,669 - $964,000
6
Beds
2
Baths
2,208
Sq Ft
$410/Sq Ft
Est. Value
About This Home
This home is located at 2879 Roberts Ave, Bronx, NY 10461 and is currently estimated at $904,417, approximately $409 per square foot. 2879 Roberts Ave is a home located in Bronx County with nearby schools including P.S. 71 Rose E Scala, Herbert H Lehman High School, and St. Theresa School.
Ownership History
Date
Name
Owned For
Owner Type
Purchase Details
Closed on
Oct 18, 2021
Sold by
Hossen Mohammad J
Bought by
Hossen Mohammad J and Razvi Mosammat Sa
Current Estimated Value
Purchase Details
Closed on
Nov 30, 2016
Sold by
Newest Inc
Bought by
Hossen Mohammad J
Home Financials for this Owner
Home Financials are based on the most recent Mortgage that was taken out on this home.
Original Mortgage
$543,192
Outstanding Balance
$437,939
Interest Rate
3.47%
Mortgage Type
FHA
Estimated Equity
$466,478
Purchase Details
Closed on
Nov 12, 2015
Sold by
Forman Esq As Referee Harry
Bought by
Newest Inc
Purchase Details
Closed on
Nov 10, 1997
Sold by
Roberto Carmine and Granata Francesco
Bought by
Mammana Giovanni and Granata Francesco
Create a Home Valuation Report for This Property
The Home Valuation Report is an in-depth analysis detailing your home's value as well as a comparison with similar homes in the area
Home Values in the Area
Average Home Value in this Area
Purchase History
| Date | Buyer | Sale Price | Title Company |
|---|---|---|---|
| Hossen Mohammad J | -- | -- | |
| Hossen Mohammad J | -- | -- | |
| Hossen Mohammad J | $590,000 | -- | |
| Hossen Mohammad J | $590,000 | -- | |
| Newest Inc | $375,000 | -- | |
| Newest Inc | $375,000 | -- | |
| Mammana Giovanni | -- | Commonwealth Land Title Ins | |
| Mammana Giovanni | -- | Commonwealth Land Title Ins |
Source: Public Records
Mortgage History
| Date | Status | Borrower | Loan Amount |
|---|---|---|---|
| Open | Hossen Mohammad J | $543,192 | |
| Closed | Hossen Mohammad J | $543,192 |
Source: Public Records
Tax History
| Year | Tax Paid | Tax Assessment Tax Assessment Total Assessment is a certain percentage of the fair market value that is determined by local assessors to be the total taxable value of land and additions on the property. | Land | Improvement |
|---|---|---|---|---|
| 2025 | $7,295 | $36,599 | $6,897 | $29,702 |
| 2024 | $7,295 | $36,322 | $7,264 | $29,058 |
| 2023 | $6,959 | $34,267 | $7,447 | $26,820 |
| 2022 | $6,454 | $47,100 | $10,380 | $36,720 |
| 2021 | $6,419 | $40,620 | $10,380 | $30,240 |
| 2020 | $6,456 | $31,320 | $10,380 | $20,940 |
| 2019 | $6,332 | $31,320 | $10,380 | $20,940 |
| 2018 | $5,821 | $28,556 | $8,085 | $20,471 |
| 2017 | $5,492 | $26,940 | $8,911 | $18,029 |
| 2016 | $5,081 | $25,416 | $8,847 | $16,569 |
| 2015 | $3,065 | $25,416 | $10,339 | $15,077 |
| 2014 | $3,065 | $25,224 | $10,621 | $14,603 |
Source: Public Records
Map
Nearby Homes
- 2874 Roberts Ave
- 1725 Edison Ave Unit 4C
- 1725 Edison Ave Unit 5D
- 1725 Edison Ave Unit 1F
- 1718 Edison Ave
- 1627 Pilgrim Ave
- 1619 Mulford Ave
- 2941 Middletown Rd
- 1826 Edison Ave
- 3036 Buhre Ave
- 1836 Mulford Ave
- 2873 Roebling Ave
- 1711 Mahan Ave
- 1865 Mulford Ave
- 1517 Gillespie Ave
- 2867 Zulette Ave
- 1815 Mahan Ave
- 1617 Mahan Ave
- 2925 Wellman Ave
- 2894 Wellman Ave
- 2881 Roberts Ave
- 2877 Roberts Ave
- 1700 Pilgrim Ave
- 1702 Pilgrim Ave
- 1710 Pilgrim Ave
- 2885 Roberts Ave
- 1711 Edison Ave
- 2887 Roberts Ave
- 1713 Edison Ave
- 1715 Edison Ave
- 2890 Westchester Ave
- 2878 Roberts Ave
- 1717 Edison Ave
- 2880 Roberts Ave
- 2876 Roberts Ave
- 2914 Westchester Ave
- 2882 Roberts Ave
- 2884 Roberts Ave
- 2901 Roberts Ave
- 1649 Edison Ave Unit 5E
Your Personal Tour Guide
Ask me questions while you tour the home.