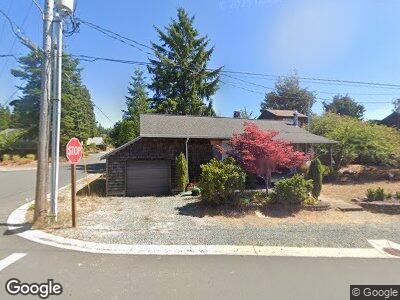
288 4th St N Manzanita, OR 97130
Estimated Value: $597,423 - $666,000
2
Beds
1
Bath
750
Sq Ft
$829/Sq Ft
Est. Value
About This Home
This home is located at 288 4th St N, Manzanita, OR 97130 and is currently estimated at $622,106, approximately $829 per square foot. 288 4th St N is a home located in Tillamook County with nearby schools including Nehalem Elementary School, Garibaldi Elementary School, and Neah-Kah-Nie Middle School.
Ownership History
Date
Name
Owned For
Owner Type
Purchase Details
Closed on
Aug 28, 2024
Sold by
Tomlinson William and Tomlinson Christine
Bought by
Buchanan Kimberly R and Ryan Holly F
Current Estimated Value
Purchase Details
Closed on
Apr 13, 2015
Sold by
Perkins Joanne C and Calcagno Connie J
Bought by
Tomlinson William and Tomlinson Christine
Home Financials for this Owner
Home Financials are based on the most recent Mortgage that was taken out on this home.
Original Mortgage
$224,000
Interest Rate
3.7%
Mortgage Type
New Conventional
Purchase Details
Closed on
Aug 30, 2005
Sold by
Wells Kenton R and Wells Vonda Lea
Bought by
Perkins Joanne C
Home Financials for this Owner
Home Financials are based on the most recent Mortgage that was taken out on this home.
Original Mortgage
$285,000
Interest Rate
5.64%
Mortgage Type
Fannie Mae Freddie Mac
Create a Home Valuation Report for This Property
The Home Valuation Report is an in-depth analysis detailing your home's value as well as a comparison with similar homes in the area
Home Values in the Area
Average Home Value in this Area
Purchase History
| Date | Buyer | Sale Price | Title Company |
|---|---|---|---|
| Buchanan Kimberly R | $621,200 | Lawyers Title | |
| Tomlinson William | $280,000 | Ticor Title Ins Co | |
| Perkins Joanne C | $364,000 | Ticor Title Ins Co |
Source: Public Records
Mortgage History
| Date | Status | Borrower | Loan Amount |
|---|---|---|---|
| Previous Owner | Tomlinson William | $224,000 | |
| Previous Owner | Perkins Joanne C | $285,000 |
Source: Public Records
Tax History Compared to Growth
Tax History
| Year | Tax Paid | Tax Assessment Tax Assessment Total Assessment is a certain percentage of the fair market value that is determined by local assessors to be the total taxable value of land and additions on the property. | Land | Improvement |
|---|---|---|---|---|
| 2024 | $2,761 | $233,500 | $130,990 | $102,510 |
| 2023 | $2,736 | $226,700 | $127,170 | $99,530 |
| 2022 | $2,573 | $220,100 | $123,470 | $96,630 |
| 2021 | $2,497 | $213,690 | $119,870 | $93,820 |
| 2020 | $2,398 | $207,470 | $116,380 | $91,090 |
| 2019 | $2,330 | $201,430 | $112,990 | $88,440 |
| 2018 | $2,270 | $195,570 | $109,710 | $85,860 |
| 2017 | $2,206 | $189,880 | $106,520 | $83,360 |
| 2016 | $2,143 | $184,350 | $103,420 | $80,930 |
| 2015 | $2,104 | $178,990 | $100,420 | $78,570 |
| 2014 | $2,069 | $173,780 | $97,500 | $76,280 |
| 2013 | -- | $168,720 | $94,660 | $74,060 |
Source: Public Records
Map
Nearby Homes
- 0 Laneda at 4th Place Unit 24-691
- 0 Laneda at 4th Place Unit 24456685
- 0 Pine Ridge Dr Unit 147 24535382
- 0 Pine Ridge Dr Unit 71 24554922
- 0 Pine Ridge Dr Unit 141 24100339
- 0 Pine Ridge Dr Unit 24394081
- 404 1st St Unit 1
- 368 4th Place
- 511 1st St
- 446 Ocean Ave
- 546 North Ave
- 175 Beach St
- 763 Madrona St
- 3300 Ave
- VL 3300 Madrona St
- 0 Knobcone St Unit 1300 467700318
- 877 Elm St Unit Lot 2
- 877 Elm St
- 726 Beach St
- VL Upland Rd
- 288 4th St N
- 288 4th St N
- 266 4th St N
- 400 Manzanita Ave
- Lot 3 Manzanita Ave
- Lot 2 Manzanita Ave
- 0 Manzanita Ave Unit 22-509
- 0 Manzanita Ave
- 419 Laurel Ave
- 224 4th St N
- 427 Laurel Ave
- 401 Manzanita Ave
- 275 4th St N
- 435 Laurel Ave
- 364 4th St N
- 448 Manzanita Ave
- 358 Manzanita Ave Unit 2
- 374 Manzanita Ave
- 253 4th St N
- 364 4th St N