Estimated Value: $134,000 - $200,000
Studio
2
Baths
3,654
Sq Ft
$46/Sq Ft
Est. Value
About This Home
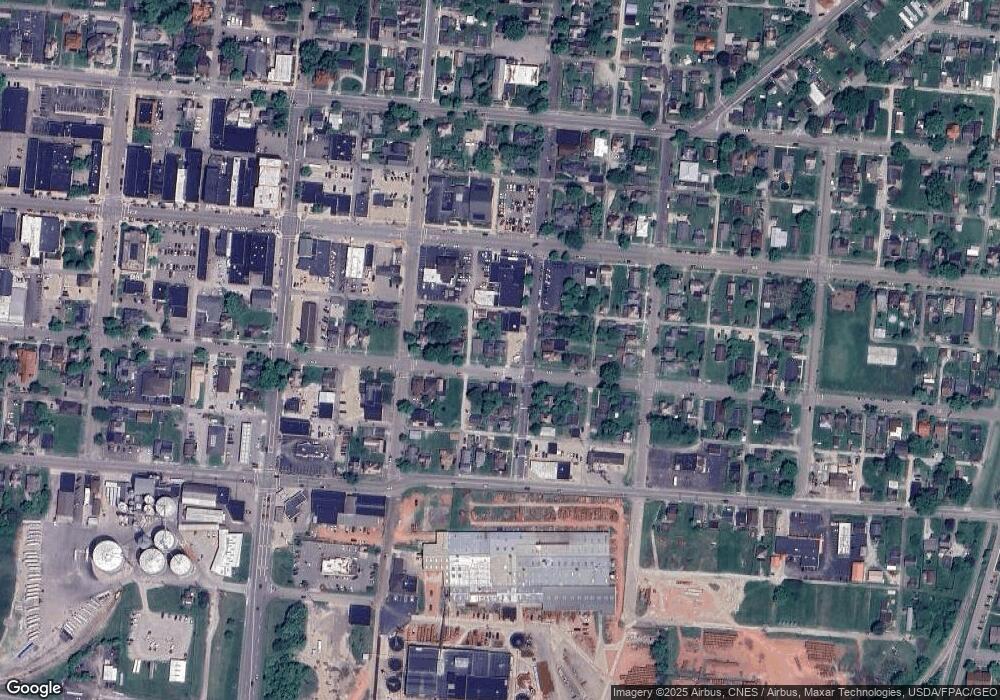
This home is located at 288 E 2nd St, Logan, OH 43138 and is currently estimated at $168,031, approximately $45 per square foot. 288 E 2nd St is a home located in Hocking County with nearby schools including Central Elementary School, St. John the Evangelist School, and Logan Christian School.
Ownership History
Date
Name
Owned For
Owner Type
Purchase Details
Closed on
Dec 11, 2018
Sold by
Fraunfelter Shawn and Fraunfelter Erin
Bought by
Fraunfelter Gregory E and Fraunfelter Deborah
Current Estimated Value
Purchase Details
Closed on
Jan 17, 2012
Sold by
Walsh Michael J and Walsh Mary Kay
Bought by
Fraunfelter Shawn and Fraunfelter Erin
Home Financials for this Owner
Home Financials are based on the most recent Mortgage that was taken out on this home.
Original Mortgage
$170,000
Interest Rate
3.98%
Mortgage Type
Future Advance Clause Open End Mortgage
Create a Home Valuation Report for This Property
The Home Valuation Report is an in-depth analysis detailing your home's value as well as a comparison with similar homes in the area
Home Values in the Area
Average Home Value in this Area
Purchase History
| Date | Buyer | Sale Price | Title Company |
|---|---|---|---|
| Fraunfelter Gregory E | -- | None Available | |
| Fraunfelter Shawn | $150,000 | None Available |
Source: Public Records
Mortgage History
| Date | Status | Borrower | Loan Amount |
|---|---|---|---|
| Closed | Fraunfelter Shawn | $170,000 |
Source: Public Records
Tax History
| Year | Tax Paid | Tax Assessment Tax Assessment Total Assessment is a certain percentage of the fair market value that is determined by local assessors to be the total taxable value of land and additions on the property. | Land | Improvement |
|---|---|---|---|---|
| 2024 | $1,001 | $24,810 | $4,950 | $19,860 |
| 2023 | $1,001 | $24,810 | $4,950 | $19,860 |
| 2022 | $1,003 | $24,810 | $4,950 | $19,860 |
| 2021 | $910 | $21,400 | $3,900 | $17,500 |
| 2020 | $910 | $21,400 | $3,900 | $17,500 |
| 2019 | $911 | $21,400 | $3,900 | $17,500 |
| 2018 | $609 | $14,570 | $3,370 | $11,200 |
| 2017 | $574 | $14,570 | $3,370 | $11,200 |
| 2016 | $569 | $14,570 | $3,370 | $11,200 |
| 2015 | $619 | $15,250 | $4,010 | $11,240 |
| 2014 | $619 | $15,250 | $4,010 | $11,240 |
| 2013 | $621 | $15,250 | $4,010 | $11,240 |
Source: Public Records
Map
Nearby Homes
Your Personal Tour Guide
Ask me questions while you tour the home.