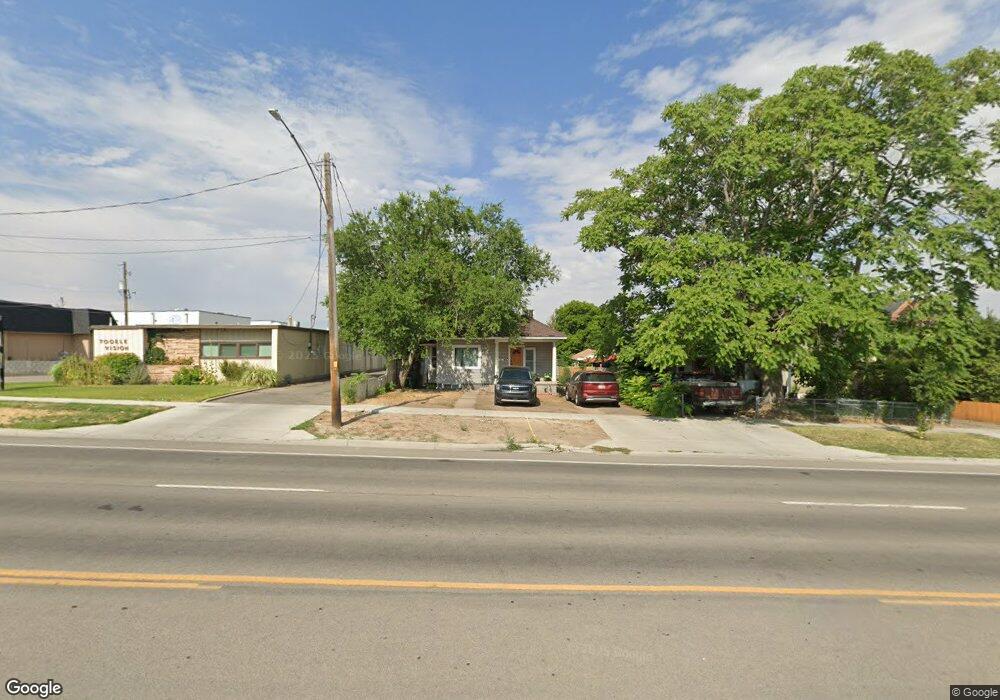
288 S Main St Tooele, UT 84074
Estimated Value: $331,000 - $396,000
5
Beds
2
Baths
1,930
Sq Ft
$182/Sq Ft
Est. Value
About This Home
This home is located at 288 S Main St, Tooele, UT 84074 and is currently estimated at $351,480, approximately $182 per square foot. 288 S Main St is a home located in Tooele County with nearby schools including Northlake Elementary School, Tooele Junior High School, and Tooele High School.
Ownership History
Date
Name
Owned For
Owner Type
Purchase Details
Closed on
May 26, 2021
Sold by
Butler Laurence L and Butler April A
Bought by
Escarcega Christopher and Johnson Bryanna
Current Estimated Value
Home Financials for this Owner
Home Financials are based on the most recent Mortgage that was taken out on this home.
Original Mortgage
$295,850
Outstanding Balance
$268,271
Interest Rate
3%
Mortgage Type
New Conventional
Estimated Equity
$83,209
Create a Home Valuation Report for This Property
The Home Valuation Report is an in-depth analysis detailing your home's value as well as a comparison with similar homes in the area
Purchase History
| Date | Buyer | Sale Price | Title Company |
|---|---|---|---|
| Escarcega Christopher | -- | Tooele Title Company |
Source: Public Records
Mortgage History
| Date | Status | Borrower | Loan Amount |
|---|---|---|---|
| Open | Escarcega Christopher | $295,850 |
Source: Public Records
Tax History
| Year | Tax Paid | Tax Assessment Tax Assessment Total Assessment is a certain percentage of the fair market value that is determined by local assessors to be the total taxable value of land and additions on the property. | Land | Improvement |
|---|---|---|---|---|
| 2025 | $2,226 | $337,559 | $61,650 | $275,909 |
| 2024 | $2,425 | $185,133 | $33,908 | $151,225 |
| 2023 | $2,425 | $177,544 | $32,120 | $145,424 |
| 2022 | $1,937 | $166,640 | $40,288 | $126,352 |
| 2021 | $1,500 | $107,928 | $16,115 | $91,813 |
| 2020 | $1,451 | $181,057 | $29,300 | $151,757 |
| 2019 | $1,313 | $161,263 | $29,300 | $131,963 |
| 2018 | $1,159 | $134,972 | $35,000 | $99,972 |
| 2017 | $855 | $118,192 | $31,063 | $87,129 |
| 2016 | $726 | $58,755 | $17,085 | $41,670 |
| 2015 | $726 | $52,829 | $0 | $0 |
| 2014 | -- | $52,829 | $0 | $0 |
Source: Public Records
Map
Nearby Homes
- 220 S Main St
- 330 S 100 E
- 354 S 100 W
- 422 S Main St
- 220 S 100 E
- 1757 N Patchwork Ave Unit 1262
- 1763 N Patchwork Ave Unit 1260
- 543 S 50 W Unit 14
- 156 S 200 E
- 197 W 100 S
- 375 Fairlane Dr
- 364 Fairlane Dr
- 264 International Ave
- 289 S 320 W
- 468 Pioneer Ave
- 248 E 100 S
- 175 E Vine St
- 304 S 3rd St
- 378 W 240 S
- 48 N 200 W
Your Personal Tour Guide
Ask me questions while you tour the home.