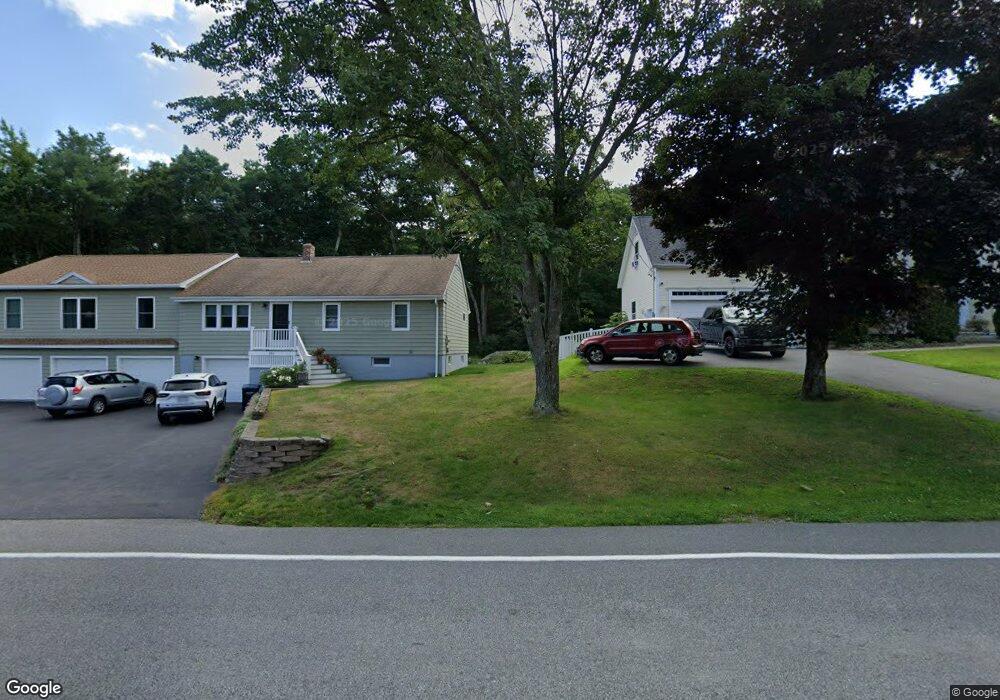
288 West St Biddeford, ME 04005
South Biddeford NeighborhoodEstimated Value: $662,000 - $733,000
4
Beds
3
Baths
2,072
Sq Ft
$334/Sq Ft
Est. Value
About This Home
This home is located at 288 West St, Biddeford, ME 04005 and is currently estimated at $692,720, approximately $334 per square foot. 288 West St is a home located in York County with nearby schools including John F Kennedy Memorial School, Biddeford Primary School, and Biddeford Intermediate School.
Ownership History
Date
Name
Owned For
Owner Type
Purchase Details
Closed on
Nov 2, 2023
Sold by
Green Karen A and Green Peter P
Bought by
The Green Irt Est
Current Estimated Value
Create a Home Valuation Report for This Property
The Home Valuation Report is an in-depth analysis detailing your home's value as well as a comparison with similar homes in the area
Home Values in the Area
Average Home Value in this Area
Purchase History
| Date | Buyer | Sale Price | Title Company |
|---|---|---|---|
| The Green Irt Est | -- | None Available | |
| The Green Irt Est | -- | None Available |
Source: Public Records
Tax History Compared to Growth
Tax History
| Year | Tax Paid | Tax Assessment Tax Assessment Total Assessment is a certain percentage of the fair market value that is determined by local assessors to be the total taxable value of land and additions on the property. | Land | Improvement |
|---|---|---|---|---|
| 2024 | $8,243 | $579,700 | $258,100 | $321,600 |
| 2023 | $6,434 | $490,400 | $168,800 | $321,600 |
| 2022 | $6,254 | $381,100 | $95,300 | $285,800 |
| 2021 | $5,460 | $324,500 | $80,600 | $243,900 |
| 2020 | $5,813 | $314,400 | $73,200 | $241,200 |
| 2019 | $3,950 | $197,700 | $69,700 | $128,000 |
| 2018 | $3,895 | $197,700 | $69,700 | $128,000 |
| 2017 | $3,631 | $180,900 | $69,700 | $111,200 |
| 2016 | $3,593 | $180,900 | $69,700 | $111,200 |
| 2015 | $3,522 | $180,900 | $69,700 | $111,200 |
| 2014 | $3,435 | $180,900 | $69,700 | $111,200 |
| 2013 | -- | $178,500 | $61,200 | $117,300 |
Source: Public Records
Map
Nearby Homes