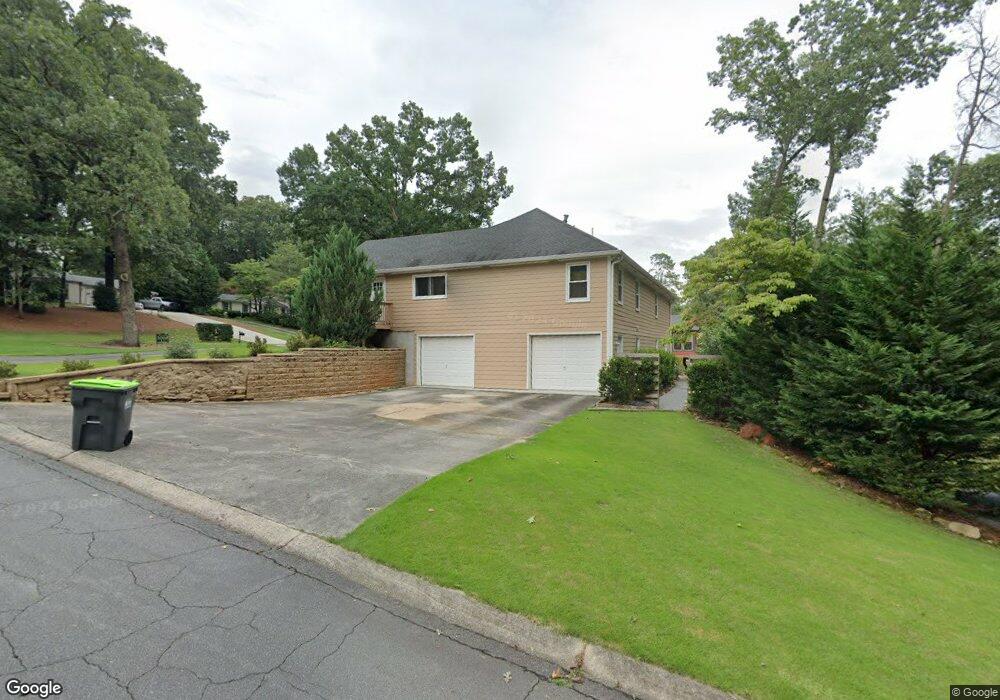
2880 Canton Hills Dr Unit 1 Marietta, GA 30062
East Cobb NeighborhoodEstimated Value: $534,000 - $596,000
4
Beds
2
Baths
2,958
Sq Ft
$189/Sq Ft
Est. Value
About This Home
This home is located at 2880 Canton Hills Dr Unit 1, Marietta, GA 30062 and is currently estimated at $557,910, approximately $188 per square foot. 2880 Canton Hills Dr Unit 1 is a home located in Cobb County with nearby schools including Murdock Elementary School, Dodgen Middle School, and Pope High School.
Ownership History
Date
Name
Owned For
Owner Type
Purchase Details
Closed on
Dec 30, 2016
Sold by
Phillips Scott and Phillips Ashley
Bought by
Oliver Kathryn E and Oliver Jemarius J
Current Estimated Value
Home Financials for this Owner
Home Financials are based on the most recent Mortgage that was taken out on this home.
Original Mortgage
$291,000
Outstanding Balance
$238,948
Interest Rate
4.08%
Mortgage Type
New Conventional
Estimated Equity
$318,962
Purchase Details
Closed on
Jun 6, 2014
Sold by
Ae&C Holdings Llc
Bought by
Phillips Scott and Phillips Ashley
Home Financials for this Owner
Home Financials are based on the most recent Mortgage that was taken out on this home.
Original Mortgage
$245,471
Interest Rate
4.25%
Mortgage Type
FHA
Purchase Details
Closed on
Jul 31, 2013
Sold by
Caces Althea
Bought by
Ae&C Holdings Llc
Create a Home Valuation Report for This Property
The Home Valuation Report is an in-depth analysis detailing your home's value as well as a comparison with similar homes in the area
Home Values in the Area
Average Home Value in this Area
Purchase History
| Date | Buyer | Sale Price | Title Company |
|---|---|---|---|
| Oliver Kathryn E | $300,000 | -- | |
| Phillips Scott | $250,000 | -- | |
| Ae&C Holdings Llc | $131,900 | -- | |
| Ae&C Holdings Llc | -- | -- | |
| Ae&C Holdings Llc | -- | -- | |
| Ae&C Holdings Llc | -- | -- | |
| Ae&C Holdings Llc | -- | -- |
Source: Public Records
Mortgage History
| Date | Status | Borrower | Loan Amount |
|---|---|---|---|
| Open | Oliver Kathryn E | $291,000 | |
| Previous Owner | Phillips Scott | $245,471 |
Source: Public Records
Tax History Compared to Growth
Tax History
| Year | Tax Paid | Tax Assessment Tax Assessment Total Assessment is a certain percentage of the fair market value that is determined by local assessors to be the total taxable value of land and additions on the property. | Land | Improvement |
|---|---|---|---|---|
| 2025 | $4,938 | $201,744 | $46,000 | $155,744 |
| 2024 | $4,942 | $201,744 | $46,000 | $155,744 |
| 2023 | $3,624 | $165,988 | $36,000 | $129,988 |
| 2022 | $3,854 | $150,296 | $36,000 | $114,296 |
| 2021 | $3,400 | $129,536 | $36,000 | $93,536 |
| 2020 | $3,400 | $129,536 | $36,000 | $93,536 |
| 2019 | $3,400 | $129,536 | $36,000 | $93,536 |
| 2018 | $3,167 | $118,888 | $36,000 | $82,888 |
| 2017 | $2,835 | $110,156 | $28,000 | $82,156 |
| 2016 | $2,283 | $99,020 | $28,000 | $71,020 |
| 2015 | $1,293 | $52,732 | $11,932 | $40,800 |
| 2014 | $1,567 | $52,732 | $0 | $0 |
Source: Public Records
Map
Nearby Homes
- 3025 Bunker Hill Cir
- 1771 Canton Hills Cir
- 2726 Whitehurst Dr NE
- 2792 Craig Ct
- 2197 Cedar Forks Dr Unit 1
- 3292 Holly Mill Ct
- 1900 Holly Springs Rd NE
- 2988 Nestle Creek Dr
- 2186 Cedar Forks Dr
- 1519 Brookcliff Cir
- 3402 Devoe Ct
- 1677 Daffodil Dr
- 2138 Cedar Forks Dr Unit 2
- 2764 Brookcliff Landing
- 1686 N Cobb Pkwy
- 2041 Kramer Way
- 3152 Normandy Cir NE
- 2880 Canton Hills Dr
- 2182 Wicks Lake Dr
- 2890 Canton Hills Dr
- 0 Meadowood Dr
- 2860 Canton Hills Dr
- 2981 Canton Hills Ct Unit 15
- 2981 Canton Hills Ct
- 0 Canton Hills Dr Unit 7499205
- 0 Canton Hills Dr Unit 8096867
- 0 Canton Hills Dr Unit 8994994
- 0 Canton Hills Dr Unit 3217703
- 3000 Canton Hills Dr Unit 2
- 2985 Canton Hills Ct
- 2881 Canton Hills Dr
- 2871 Canton Hills Dr
- 1897 Meadowood Dr
- 2891 Canton Hills Dr
- 2850 Canton Hills Dr Unit 2
- 2991 Canton Hills Ct
- 2861 Canton Hills Dr Unit 2