2880 N Quincy Rd Turlock, CA 95382
Estimated payment $13,389/month
Highlights
- 17.14 Acre Lot
- Crops Farm
- Partially Fenced Property
- No HOA
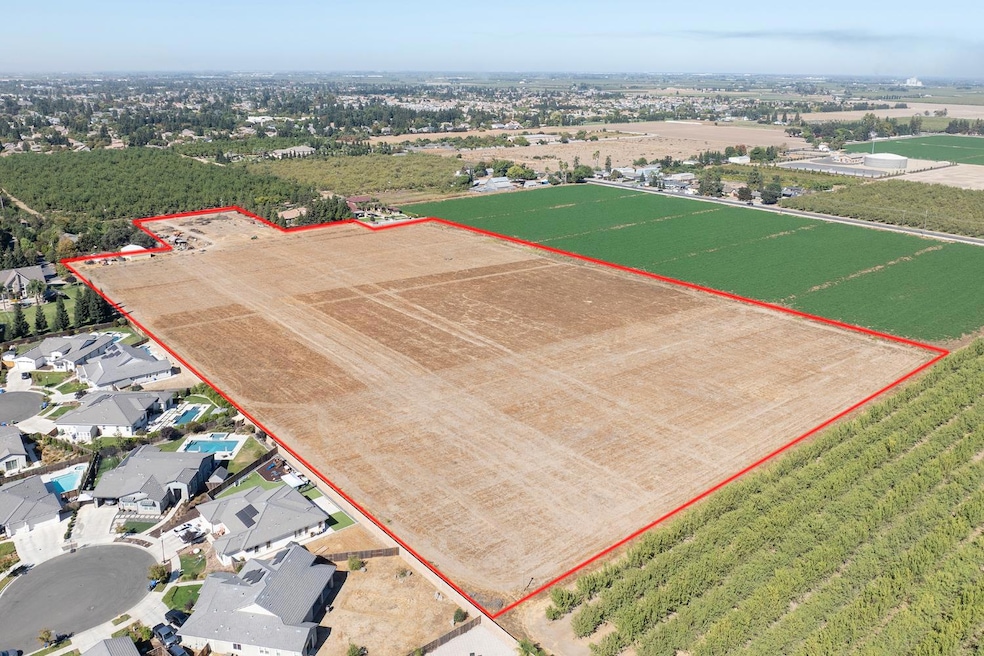
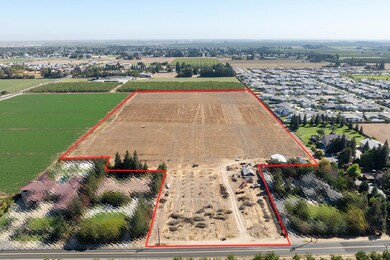
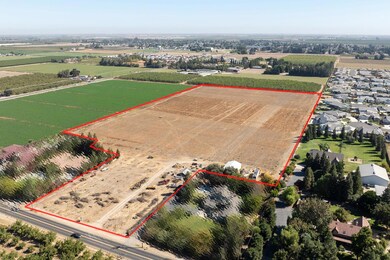
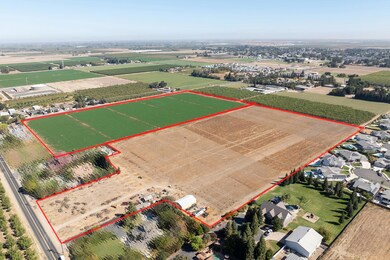
About This Lot
Rare opportunity to develop 17.12 acres of prime land in Turlock's prestigious east side, where custom high-end homes define the neighborhood. This exceptional parcel is ideally positioned for a single-family residential subdivision, surrounded by upscale developments that set the standard for quality living in the area. The property sits at the city limits and will require annexation, offering developers a blank canvas to create the next sought-after community. Essential infrastructure is conveniently accessible with water running along Quincy and sewer along Monte Vista, streamlining development timelines and reducing costs. The strategic location on Turlock's easterly side places future residents in one of the city's most desirable growth corridors. An adjacent 17-acre parcel is also available for sale, presenting a unique chance to secure 34+ acres total for a more substantial master-planned community. This is an exceptional find for developers seeking high-potential land in an established, upscale market where demand for quality housing continues to grow.
Listing Agent
Century 21 Select Real Estate License #01225017 Listed on: 10/14/2025

Property Details
Property Type
- Land
Est. Annual Taxes
- $25,158
Lot Details
- 17.14 Acre Lot
- Property fronts a county road
- Partially Fenced Property
- Possible uses of the property include Subdivision
- Zoning described as Agricultural/Residential
Farming
- Crops Farm
- Crops
Community Details
- No Home Owners Association
Listing and Financial Details
- Assessor Parcel Number 073-011-021-000
Map
Home Values in the Area
Average Home Value in this Area
Tax History
| Year | Tax Paid | Tax Assessment Tax Assessment Total Assessment is a certain percentage of the fair market value that is determined by local assessors to be the total taxable value of land and additions on the property. | Land | Improvement |
|---|---|---|---|---|
| 2025 | $25,158 | $2,176,463 | $1,334,135 | $842,328 |
| 2024 | $24,573 | $2,133,345 | $1,307,976 | $825,369 |
| 2023 | $32,270 | $2,828,655 | $1,282,330 | $1,546,325 |
| 2022 | $29,246 | $2,567,258 | $1,257,187 | $1,310,071 |
| 2021 | $29,284 | $2,528,848 | $1,232,537 | $1,296,311 |
| 2020 | $29,204 | $2,518,993 | $1,219,899 | $1,299,094 |
| 2019 | $23,637 | $2,112,791 | $1,195,980 | $916,811 |
| 2018 | $23,976 | $2,087,788 | $1,172,530 | $915,258 |
| 2017 | $23,789 | $2,093,000 | $1,149,540 | $943,460 |
| 2016 | -- | $1,295,493 | $531,837 | $763,656 |
| 2015 | $8,800 | $792,000 | $352,000 | $440,000 |
| 2014 | $8,948 | $792,000 | $352,000 | $440,000 |
Property History
| Date | Event | Price | List to Sale | Price per Sq Ft |
|---|---|---|---|---|
| 10/14/2025 10/14/25 | For Sale | $2,142,500 | -- | -- |
Purchase History
| Date | Type | Sale Price | Title Company |
|---|---|---|---|
| Contract Of Sale | -- | -- | |
| Contract Of Sale | -- | -- | |
| Contract Of Sale | -- | -- | |
| Grant Deed | $1,800,000 | Stewart Title Of Ca Inc | |
| Interfamily Deed Transfer | -- | None Available |
Source: MetroList
MLS Number: 225109392
APN: 073-11-21
Disclaimer: Certain information contained herein is derived from information provided by parties other than Homes.com. All information provided is deemed reliable, but is not guaranteed to be accurate and should be independently verified.
![]() IDX information is provided exclusively for personal, non-commercial use, and may not be used for any purpose other than to identify prospective properties consumers may be interested in purchasing. Information is deemed reliable but not guaranteed.
IDX information is provided exclusively for personal, non-commercial use, and may not be used for any purpose other than to identify prospective properties consumers may be interested in purchasing. Information is deemed reliable but not guaranteed.
- 1943 Alex Way
- 2575 Kensington Ct
- 2754 Millstream Ln
- 1880 Westminster Ln
- 2218 E Tuolumne Rd
- 2200 E Tuolumne Rd
- 2127 Bristol Park Cir
- 2791 E Tuolumne Rd
- 2897 Margot Ln
- 0 Hogin Rd Unit MC25187945
- 0 Hogin Rd Unit 225067168
- 2240 N Berkeley Ave
- 3418 N Waring Rd Unit 71
- 1345 Alex Cir
- 2351 Lynborough Ct
- 3703 Brookstone Dr
- 1850 Hammond Dr
- 3715 N Berkeley Ave
- 3710 Spyglass Ln
- 3620 E Monte Vista Ave
- 1403 E Monte Vista Ave
- 2090 N Berkeley Ave
- 1749 N Olive Ave
- 2481 E Canal Dr Unit Sunshine Studio
- 2471 E Canal Dr Unit Sequoia studio
- 3108 James Ln
- 351 E Monte Vista Ave
- 275 E Minnesota Ave
- 3661 La Mancha Place
- 3639 Nicole Ct
- 303 Wayside Dr
- 3155 Niagra St
- 3155 Niagra St
- 3155 Niagra St
- 3155 Niagra St
- 4610 Fosberg Rd
- 300 Tampa St
- 1094 Geer Rd
- 4125 Pathway Ln
- 267 W Springer Dr