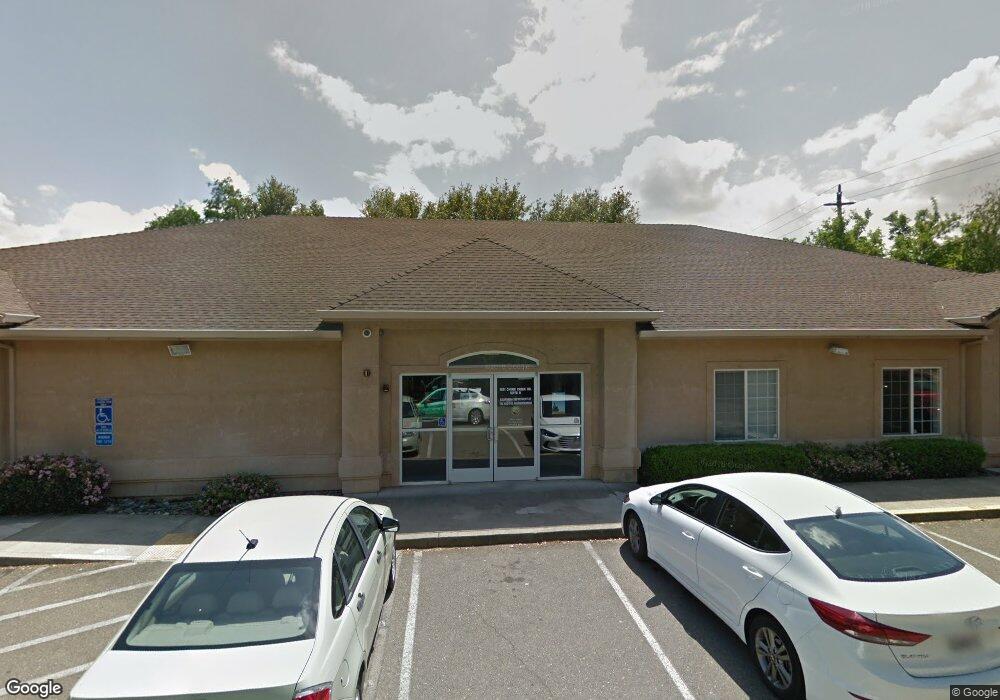
2881 Churn Creek Rd Redding, CA 96002
Reservoir NeighborhoodEstimated Value: $1,178,348
--
Bed
2
Baths
7,192
Sq Ft
$164/Sq Ft
Est. Value
About This Home
This home is located at 2881 Churn Creek Rd, Redding, CA 96002 and is currently estimated at $1,178,348, approximately $163 per square foot. 2881 Churn Creek Rd is a home located in Shasta County with nearby schools including Rother Elementary School, Parsons Junior High School, and Enterprise High School.
Ownership History
Date
Name
Owned For
Owner Type
Purchase Details
Closed on
Apr 29, 2020
Sold by
Easley Gale E and Easley Mary Jo
Bought by
Miscke Llc
Current Estimated Value
Home Financials for this Owner
Home Financials are based on the most recent Mortgage that was taken out on this home.
Original Mortgage
$200,000
Outstanding Balance
$178,213
Interest Rate
3.6%
Mortgage Type
Commercial
Estimated Equity
$1,000,135
Purchase Details
Closed on
May 15, 2013
Sold by
Dall Era Arnaldo G and Dall Era Christina P
Bought by
Easley Gale E and Easley Mary Jo A
Home Financials for this Owner
Home Financials are based on the most recent Mortgage that was taken out on this home.
Original Mortgage
$367,500
Interest Rate
3.32%
Mortgage Type
Commercial
Purchase Details
Closed on
May 20, 2002
Sold by
Concept Development Corp
Bought by
Dallera Arnaldo G and Dallera Christina P
Create a Home Valuation Report for This Property
The Home Valuation Report is an in-depth analysis detailing your home's value as well as a comparison with similar homes in the area
Home Values in the Area
Average Home Value in this Area
Purchase History
| Date | Buyer | Sale Price | Title Company |
|---|---|---|---|
| Miscke Llc | $900,000 | Placer Title Company | |
| Easley Gale E | $735,000 | Placer Title Company | |
| Dallera Arnaldo G | $819,000 | Alliance Title Company |
Source: Public Records
Mortgage History
| Date | Status | Borrower | Loan Amount |
|---|---|---|---|
| Open | Miscke Llc | $200,000 | |
| Previous Owner | Easley Gale E | $367,500 |
Source: Public Records
Tax History Compared to Growth
Tax History
| Year | Tax Paid | Tax Assessment Tax Assessment Total Assessment is a certain percentage of the fair market value that is determined by local assessors to be the total taxable value of land and additions on the property. | Land | Improvement |
|---|---|---|---|---|
| 2025 | $10,796 | $984,277 | $218,727 | $765,550 |
| 2024 | $10,646 | $964,979 | $214,439 | $750,540 |
| 2023 | $10,646 | $946,059 | $210,235 | $735,824 |
| 2022 | $10,347 | $927,510 | $206,113 | $721,397 |
| 2021 | $9,997 | $909,324 | $202,072 | $707,252 |
| 2020 | $9,170 | $827,591 | $197,043 | $630,548 |
| 2019 | $9,097 | $811,365 | $193,180 | $618,185 |
| 2018 | $8,993 | $795,457 | $189,393 | $606,064 |
| 2017 | $9,151 | $779,861 | $185,680 | $594,181 |
| 2016 | $8,565 | $764,571 | $182,040 | $582,531 |
| 2015 | $8,495 | $753,087 | $179,306 | $573,781 |
| 2014 | $8,435 | $738,336 | $175,794 | $562,542 |
Source: Public Records
Map
Nearby Homes
- 2953 Churn Ct
- 2901 Blue View St
- 0 Churn Creek Rd Unit 25-496
- 2915 Rockabye Ln
- 2919 Blueview St
- 2786 Larkspur Ln
- 1221 E Cypress Ave Unit 67
- 2820 Alfreda Way
- 3178 Lawrence Rd
- 1091 Del Sol Place
- 1118 4th St
- 3428 Adams Ln
- 2810 Bechelli Ln
- 952 Camino Ct
- 1535 E Cypress Ave
- 953 Camino Ct
- 3283 Middleton Ln
- 3527 Adams Ln
- 385 Manzanita Ln
- 3293 Middleton Ln
- 2881 Churn Creek Suite A Rd
- 2901 Churn Creek Rd
- 2931 Churn Creek Rd
- 2925 Churn Creek Rd
- 2861 Churn Creek Rd
- 2919 Churn Creek Rd
- 2841 Churn Creek Rd
- 2937 Churn Creek Rd
- 2885 Churn Creek Rd
- 2865 Churn Creek Rd
- 2865 Churn Creek Rd
- 2951 Churn Creek Rd
- 2873 Churn Creek Rd
- 2880 Churn Creek Rd
- 2872 Churn Creek Rd
- 2874 Churn Creek Rd
- 2955 Churn Creek Rd
- 2860 Churn Creek Rd
- 2820 Churn Creek Rd Unit 1
- 2820 Churn Creek Rd