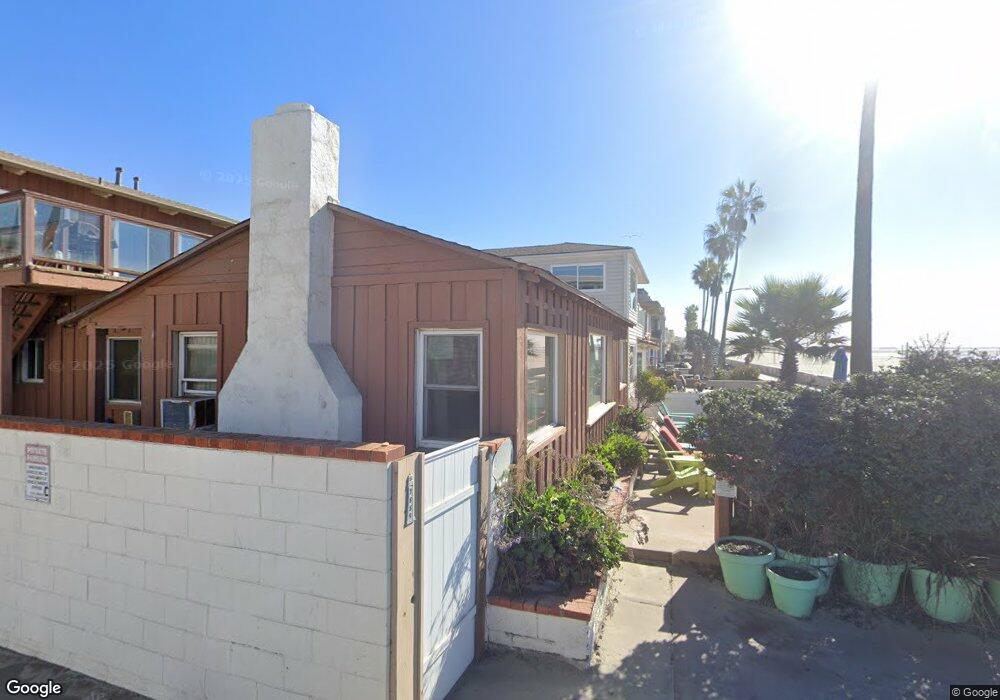
2881 Ocean Front Walk Unit 83 San Diego, CA 92109
Mission Beach NeighborhoodEstimated Value: $2,731,000 - $3,558,000
3
Beds
3
Baths
2,135
Sq Ft
$1,456/Sq Ft
Est. Value
About This Home
This home is located at 2881 Ocean Front Walk Unit 83, San Diego, CA 92109 and is currently estimated at $3,107,602, approximately $1,455 per square foot. 2881 Ocean Front Walk Unit 83 is a home located in San Diego County with nearby schools including Pacific Beach Elementary School, Pacific Beach Middle, and Mission Bay High School.
Ownership History
Date
Name
Owned For
Owner Type
Purchase Details
Closed on
Dec 22, 2021
Sold by
Williams Flora Padilla
Bought by
Bruce E Williams Irrevocable Spousal Trust and Williams
Current Estimated Value
Purchase Details
Closed on
Sep 14, 2001
Sold by
Bryson Larry E
Bought by
Williams Bruce E and Williams Marna M
Home Financials for this Owner
Home Financials are based on the most recent Mortgage that was taken out on this home.
Original Mortgage
$800,000
Interest Rate
7.67%
Purchase Details
Closed on
Sep 13, 1996
Sold by
Crawford Gary D and Crawford Christy S
Bought by
Buckley Stephan S
Purchase Details
Closed on
Dec 29, 1989
Purchase Details
Closed on
Sep 19, 1986
Create a Home Valuation Report for This Property
The Home Valuation Report is an in-depth analysis detailing your home's value as well as a comparison with similar homes in the area
Home Values in the Area
Average Home Value in this Area
Purchase History
| Date | Buyer | Sale Price | Title Company |
|---|---|---|---|
| Bruce E Williams Irrevocable Spousal Trust | -- | None Listed On Document | |
| Williams Flora Padilla | -- | None Listed On Document | |
| Williams Bruce E | -- | None Listed On Document | |
| Williams Bruce E | $1,510,000 | Chicago Title Co | |
| Buckley Stephan S | -- | Fidelity National Title Ins | |
| -- | $775,000 | -- | |
| -- | $500,000 | -- |
Source: Public Records
Mortgage History
| Date | Status | Borrower | Loan Amount |
|---|---|---|---|
| Previous Owner | Williams Bruce E | $800,000 |
Source: Public Records
Tax History Compared to Growth
Tax History
| Year | Tax Paid | Tax Assessment Tax Assessment Total Assessment is a certain percentage of the fair market value that is determined by local assessors to be the total taxable value of land and additions on the property. | Land | Improvement |
|---|---|---|---|---|
| 2025 | $26,916 | $2,230,715 | $1,625,028 | $605,687 |
| 2024 | $26,916 | $2,186,976 | $1,593,165 | $593,811 |
| 2023 | $26,323 | $2,144,095 | $1,561,927 | $582,168 |
| 2022 | $25,621 | $2,102,054 | $1,531,301 | $570,753 |
| 2021 | $25,444 | $2,060,838 | $1,501,276 | $559,562 |
| 2020 | $25,130 | $2,039,708 | $1,485,883 | $553,825 |
| 2019 | $24,681 | $1,999,715 | $1,456,749 | $542,966 |
| 2018 | $23,073 | $1,960,506 | $1,428,186 | $532,320 |
| 2017 | $80 | $1,922,066 | $1,400,183 | $521,883 |
| 2016 | $22,178 | $1,884,379 | $1,372,729 | $511,650 |
| 2015 | $21,851 | $1,856,075 | $1,352,110 | $503,965 |
| 2014 | $21,500 | $1,819,719 | $1,325,625 | $494,094 |
Source: Public Records
Map
Nearby Homes
- 2820 Bayside Walk Unit 2
- 2808 Bayside Walk Unit B
- 2965 Mission Blvd Unit 4C
- 808 Ensenada Ct
- 2999 Mission Blvd Unit 201
- 2740 Ocean Front Walk
- 2735 Mission Blvd
- 2727 Ocean Front Walk Unit 3
- 722 San Luis Rey Place Unit 24
- 817 San Luis Rey Place
- 801 Allerton Ct
- 2623 Ocean Front Walk
- 2617 Ocean Front Walk
- 2632 Bayside Walk
- 717 Island Ct
- 728 Jamaica Ct
- 3286-88 Bayside Walk
- 3291 Bayside Walk
- 810 Santa Barbara Place
- 735 Jersey Ct
- 2887 Ocean Front Walk
- 2873 Ocean Front Walk Unit 79
- 714 Deal Ct
- 2889 Ocean Front Walk
- 711 San Gabriel Place Unit 1
- 715 San Gabriel Place Unit 2
- 2865-67 Ocean Front Walk
- 2865 Ocean Front Walk
- 718 Deal Ct
- 717 San Gabriel Place Unit L1
- 719 San Gabriel Place Unit L2
- 5 Ocean Front Walk
- 722 Deal Ct
- 715 Deal Ct
- 713 Deal Ct Unit 15
- 2907 Ocean Front Walk
- 2905 Ocean Front Walk
- 725 San Gabriel Place
- 723 San Gabriel Place
- 2861 Ocean Front Walk Unit 63