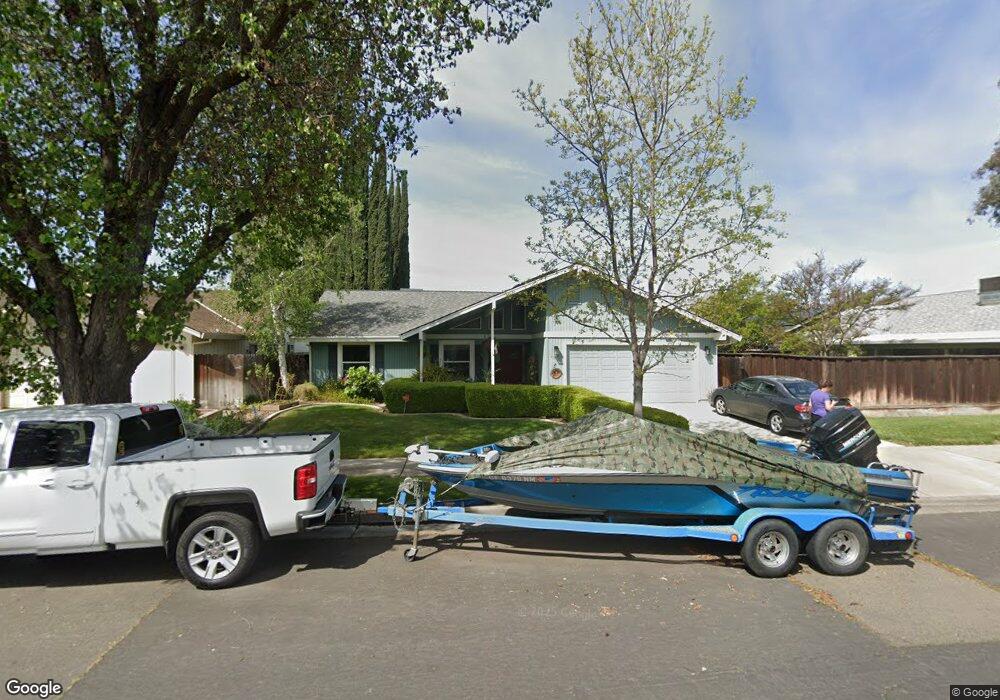
2881 Saint Phillip Dr Merced, CA 95348
North Merced NeighborhoodEstimated Value: $171,000 - $379,440
3
Beds
2
Baths
1,472
Sq Ft
$216/Sq Ft
Est. Value
About This Home
This home is located at 2881 Saint Phillip Dr, Merced, CA 95348 and is currently estimated at $317,610, approximately $215 per square foot. 2881 Saint Phillip Dr is a home located in Merced County with nearby schools including Luther Burbank Elementary School, Herbert Hoover Middle School, and Merced High School.
Ownership History
Date
Name
Owned For
Owner Type
Purchase Details
Closed on
Sep 27, 2017
Sold by
Frank Vickey
Bought by
Devarona Juan Carlos and Devarona Jame J
Current Estimated Value
Home Financials for this Owner
Home Financials are based on the most recent Mortgage that was taken out on this home.
Original Mortgage
$142,400
Outstanding Balance
$118,944
Interest Rate
3.82%
Mortgage Type
New Conventional
Estimated Equity
$198,666
Purchase Details
Closed on
Jan 25, 2008
Sold by
Us Bank Na
Bought by
Frank Vickey
Home Financials for this Owner
Home Financials are based on the most recent Mortgage that was taken out on this home.
Original Mortgage
$164,912
Interest Rate
5.85%
Mortgage Type
FHA
Purchase Details
Closed on
Oct 30, 2007
Sold by
Mason Paula C
Bought by
U S Bank Na and Mastr Asset Backed Securities Tr 2005-Fr
Create a Home Valuation Report for This Property
The Home Valuation Report is an in-depth analysis detailing your home's value as well as a comparison with similar homes in the area
Home Values in the Area
Average Home Value in this Area
Purchase History
| Date | Buyer | Sale Price | Title Company |
|---|---|---|---|
| Devarona Juan Carlos | $178,000 | First American Title Company | |
| Frank Vickey | $167,500 | North American Title Company | |
| U S Bank Na | $218,338 | None Available |
Source: Public Records
Mortgage History
| Date | Status | Borrower | Loan Amount |
|---|---|---|---|
| Open | Devarona Juan Carlos | $142,400 | |
| Previous Owner | Frank Vickey | $164,912 |
Source: Public Records
Tax History Compared to Growth
Tax History
| Year | Tax Paid | Tax Assessment Tax Assessment Total Assessment is a certain percentage of the fair market value that is determined by local assessors to be the total taxable value of land and additions on the property. | Land | Improvement |
|---|---|---|---|---|
| 2025 | $2,147 | $202,530 | $51,200 | $151,330 |
| 2024 | $2,147 | $198,560 | $50,197 | $148,363 |
| 2023 | $2,118 | $194,667 | $49,213 | $145,454 |
| 2022 | $2,089 | $190,851 | $48,249 | $142,602 |
| 2021 | $2,085 | $187,109 | $47,303 | $139,806 |
| 2020 | $2,100 | $185,191 | $46,818 | $138,373 |
| 2019 | $2,070 | $181,560 | $45,900 | $135,660 |
| 2018 | $1,889 | $178,000 | $45,000 | $133,000 |
| 2017 | $3,859 | $189,568 | $79,221 | $110,347 |
| 2016 | $2,016 | $185,852 | $77,668 | $108,184 |
| 2015 | $1,983 | $183,061 | $76,502 | $106,559 |
| 2014 | $1,722 | $160,000 | $30,000 | $130,000 |
Source: Public Records
Map
Nearby Homes
- 524 St Kevin Ct
- 610 Rambler Rd
- 677 Northwood Dr
- 261 W 26th St
- 2875 Evergreen Rd
- 415 W 25th St
- 98 Sandy Ln
- 2500 N St Unit 270
- 121 W 25th St
- 2320 K St
- 2819 Tenaya Dr
- 8 W 25th St
- 200 E 27th St
- 5830 N Rio Bonito Ct
- 1061 Northwood Dr
- 3150 College Ave
- 439 E Olive Ave
- 2806 Tahoe Dr
- 688 Elise Ct
- 3191 El Capitan Ave
- 2881 St Phillip Dr
- 2871 St Phillip Dr
- 348 St Michelle Ct
- 358 St Michelle Ct
- 2872 St Thomas Ct
- 2861 St Phillip Dr
- 2882 St Thomas Ct
- 368 St Michelle Ct
- 2874 St Phillip Dr
- 2880 St Phillip Dr
- 2860 St Phillip Dr
- 2862 St Thomas Ct
- 338 St Michelle Dr
- 333 St Lawrence Dr
- 2887 St Thomas Ct
- 2850 St Phillip Dr
- 388 St Michelle Ct
- 377 St Lawrence Dr
- 349 St Michelle Ct
- 339 St Michelle Ct