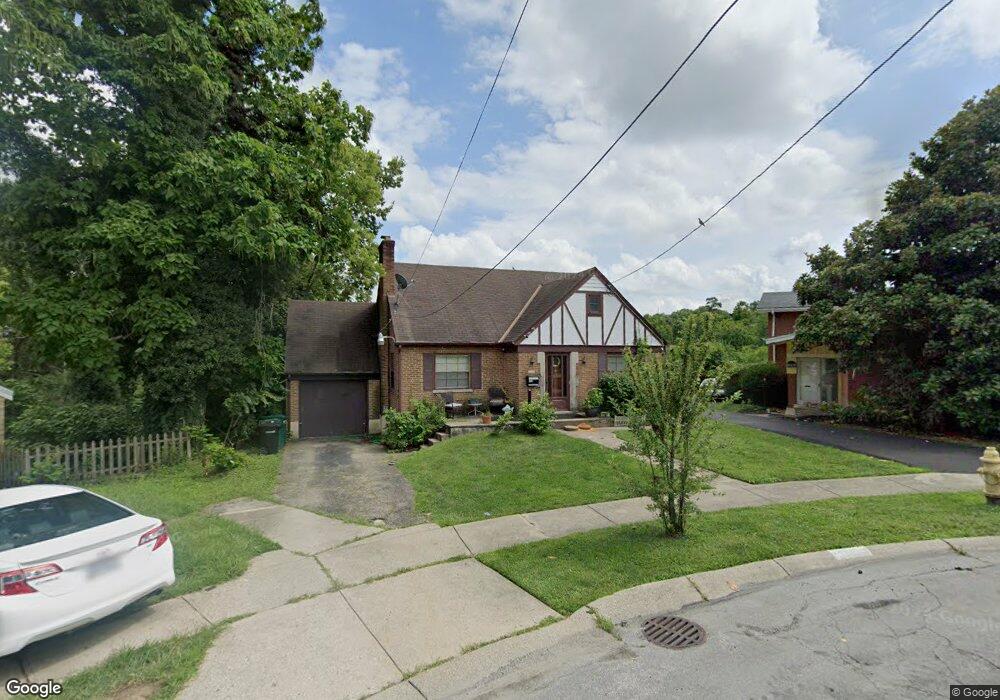
2881 West Tower Ave Cincinnati, OH 45238
Westwood NeighborhoodEstimated Value: $214,000 - $244,082
3
Beds
2
Baths
1,665
Sq Ft
$140/Sq Ft
Est. Value
About This Home
This home is located at 2881 West Tower Ave, Cincinnati, OH 45238 and is currently estimated at $232,271, approximately $139 per square foot. 2881 West Tower Ave is a home located in Hamilton County with nearby schools including Midway Elementary School, Western Hills High School, and Gilbert A. Dater High School.
Ownership History
Date
Name
Owned For
Owner Type
Purchase Details
Closed on
Jun 27, 2003
Sold by
Vale Grergory P and Vale Carrie C
Bought by
Mullins Phillip W and Mullins Jody S
Current Estimated Value
Home Financials for this Owner
Home Financials are based on the most recent Mortgage that was taken out on this home.
Original Mortgage
$96,900
Outstanding Balance
$41,631
Interest Rate
5.4%
Mortgage Type
Unknown
Estimated Equity
$190,640
Purchase Details
Closed on
Jun 11, 1999
Sold by
Walsh Cheryl J and Walsh John
Bought by
Vale Gregory P
Home Financials for this Owner
Home Financials are based on the most recent Mortgage that was taken out on this home.
Original Mortgage
$98,645
Interest Rate
7.15%
Purchase Details
Closed on
Jun 6, 1995
Sold by
Schlie Thomas J
Bought by
Walsh Cheryl J and Walsh John
Home Financials for this Owner
Home Financials are based on the most recent Mortgage that was taken out on this home.
Original Mortgage
$85,992
Interest Rate
8.27%
Mortgage Type
FHA
Create a Home Valuation Report for This Property
The Home Valuation Report is an in-depth analysis detailing your home's value as well as a comparison with similar homes in the area
Home Values in the Area
Average Home Value in this Area
Purchase History
| Date | Buyer | Sale Price | Title Company |
|---|---|---|---|
| Mullins Phillip W | $114,000 | Advanced Land Title Agency L | |
| Vale Gregory P | $98,700 | -- | |
| Walsh Cheryl J | -- | -- |
Source: Public Records
Mortgage History
| Date | Status | Borrower | Loan Amount |
|---|---|---|---|
| Open | Mullins Phillip W | $96,900 | |
| Previous Owner | Vale Gregory P | $98,645 | |
| Previous Owner | Walsh Cheryl J | $85,992 |
Source: Public Records
Tax History Compared to Growth
Tax History
| Year | Tax Paid | Tax Assessment Tax Assessment Total Assessment is a certain percentage of the fair market value that is determined by local assessors to be the total taxable value of land and additions on the property. | Land | Improvement |
|---|---|---|---|---|
| 2024 | $3,767 | $63,046 | $11,095 | $51,951 |
| 2023 | $3,852 | $63,046 | $11,095 | $51,951 |
| 2022 | $2,303 | $33,737 | $10,780 | $22,957 |
| 2021 | $2,215 | $33,737 | $10,780 | $22,957 |
| 2020 | $2,280 | $33,737 | $10,780 | $22,957 |
| 2019 | $2,265 | $30,671 | $9,800 | $20,871 |
| 2018 | $2,268 | $30,671 | $9,800 | $20,871 |
| 2017 | $2,155 | $30,671 | $9,800 | $20,871 |
| 2016 | $2,611 | $36,666 | $9,408 | $27,258 |
| 2015 | $2,354 | $36,666 | $9,408 | $27,258 |
| 2014 | $2,371 | $36,666 | $9,408 | $27,258 |
| 2013 | $2,512 | $38,192 | $9,800 | $28,392 |
Source: Public Records
Map
Nearby Homes
- 2936 W Tower Ave
- 2957 Veazey Ave
- 2348 Ferguson Rd
- 2914 Queen City Ave
- 3020 Veazey Ave
- 2739 Westbrook Dr
- 3037 N Hegry Cir
- 3032 S Hegry Cir
- 2974 Westbrook Dr
- 3088 Queen City Ave
- 4925 Shirley Place
- 4910 Ferguson Place
- 4769 Hardwick Dr
- 3141 W Tower Ave
- 3007 Ideal Terrace
- 2925 Boudinot Ave
- 3055 Westbrook Dr
- 4798 Prosperity Place
- 1869 Ashbrook Dr
- 1861 Ashbrook Dr
- 2883 West Tower Ave
- 2877 W Tower Ave
- 2877 West Tower Ave
- 2864 Veazey Ave
- 2493 Dunaway Ct
- 2856 Veazey Ave
- 2872 Veazey Ave
- 2497 Dunaway Ct
- 2489 Dunaway Ct
- 2501 Dunaway Ct
- 2882 West Tower Ave
- 2885 W Tower Ave
- 2848 Veazey Ave
- 2885 West Tower Ave
- 2886 Veazey Ave
- 2840 Veazey Ave
- 2888 Veazey Ave
- 2505 Dunaway Ct
- 2887 W Tower Ave
- 2887 West Tower Ave