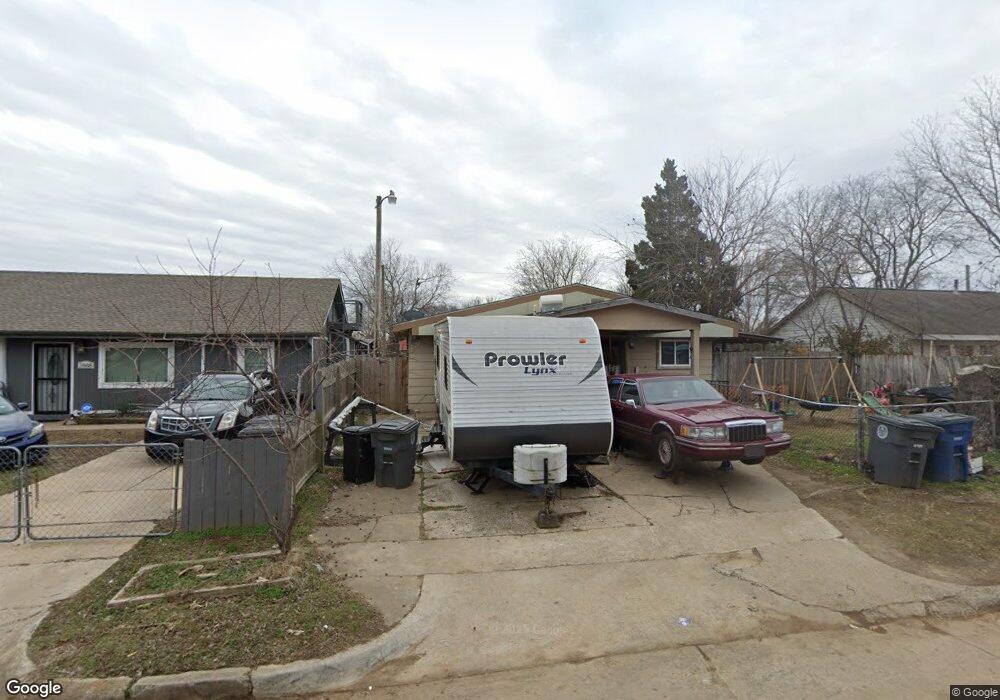
2882 E 44th Place N Tulsa, OK 74110
Lake Yahola NeighborhoodEstimated Value: $63,120 - $135,000
3
Beds
1
Bath
1,156
Sq Ft
$83/Sq Ft
Est. Value
About This Home
This home is located at 2882 E 44th Place N, Tulsa, OK 74110 and is currently estimated at $95,530, approximately $82 per square foot. 2882 E 44th Place N is a home located in Tulsa County with nearby schools including Anderson Elementary School, Monroe Demonstration Academy, and McLain High School of Science and Technology.
Ownership History
Date
Name
Owned For
Owner Type
Purchase Details
Closed on
Sep 20, 2017
Sold by
The Brady Impact Trust
Bought by
Innovative Asset Management Llc
Current Estimated Value
Purchase Details
Closed on
Feb 1, 2017
Sold by
Sg Capital Partners Llc
Bought by
The Brady Impact Trust and Wilmington Savings Fund Society Fsb
Purchase Details
Closed on
Dec 8, 2015
Sold by
Vi Harbour Portfolio
Bought by
Sg Capital Partners Llc
Purchase Details
Closed on
Dec 30, 2010
Sold by
Net Net Llc
Bought by
Harbour Portfolio Vi Lp
Purchase Details
Closed on
Mar 24, 2009
Sold by
American General Finance Services Inc
Bought by
Netnet Llc
Purchase Details
Closed on
Jan 7, 2009
Sold by
Mcgee Joshua D and Mcgee Misty L
Bought by
American General Finance Inc
Purchase Details
Closed on
Sep 8, 2004
Sold by
State Of Oklahoma
Bought by
Mcgee Joshua D
Purchase Details
Closed on
Jun 1, 1992
Create a Home Valuation Report for This Property
The Home Valuation Report is an in-depth analysis detailing your home's value as well as a comparison with similar homes in the area
Home Values in the Area
Average Home Value in this Area
Purchase History
| Date | Buyer | Sale Price | Title Company |
|---|---|---|---|
| Innovative Asset Management Llc | $19,235 | None Available | |
| The Brady Impact Trust | $15,954 | None Available | |
| Sg Capital Partners Llc | $18,500 | None Available | |
| Harbour Portfolio Vi Lp | $12,000 | None Available | |
| Netnet Llc | $5,000 | None Available | |
| American General Finance Inc | -- | None Available | |
| Mcgee Joshua D | $1,592 | -- | |
| -- | $10,000 | -- |
Source: Public Records
Tax History Compared to Growth
Tax History
| Year | Tax Paid | Tax Assessment Tax Assessment Total Assessment is a certain percentage of the fair market value that is determined by local assessors to be the total taxable value of land and additions on the property. | Land | Improvement |
|---|---|---|---|---|
| 2025 | $412 | $3,076 | $244 | $2,832 |
| 2024 | $354 | $2,929 | $279 | $2,650 |
| 2023 | $354 | $2,789 | $305 | $2,484 |
| 2022 | $354 | $2,656 | $334 | $2,322 |
| 2021 | $334 | $2,530 | $440 | $2,090 |
| 2020 | $330 | $2,530 | $440 | $2,090 |
| 2019 | $347 | $2,530 | $440 | $2,090 |
| 2018 | $347 | $2,530 | $440 | $2,090 |
| 2017 | $362 | $2,640 | $440 | $2,200 |
| 2016 | $354 | $2,640 | $440 | $2,200 |
| 2015 | $355 | $2,640 | $440 | $2,200 |
| 2014 | $352 | $2,640 | $440 | $2,200 |
Source: Public Records
Map
Nearby Homes
- 2829 E 44th Place N
- 3868 N Delaware Ave
- 3531 E 33rd St N
- 2323 N Atlanta Ave E
- 4813 N Wheeling Ave
- 2231 E 32nd Place N
- 2240 E 32nd St N
- 4939 N Trenton Ave
- 4634 N Saint Louis Ave
- 4912 N Saint Louis Ave
- 4986 N Trenton
- 4948 N Saint Louis Ave
- 6102 N Lewis Ave
- 1551 E 51st St N
- 1581 E 53rd St N
- 2415 E 29th St N
- 3711 E 29th Place N
- 1539 E 53rd St N
- 1524 E 53rd St N
- 5533 N Utica Ave
- 2884 E 44th St N
- 2888 E 44th St N
- 2878 E 44th St N
- 2874 E 44th St N
- 2881 E 43rd St N
- 2887 E 43rd St N
- 2877 E 43rd St N
- 2883 E 44th St N
- 2877 E 44th St N
- 2873 E 43rd St N
- 2887 E 44th St N
- 2868 E 44th St N
- 2871 E 44th St N
- 4317 N Evanston Place
- 2867 E 43rd St N
- 4311 N Evanston Place
- 2864 E 44th St N
- 4307 N Evanston Place
- 4403 N Evanston Place
- 4303 N Evanston Place