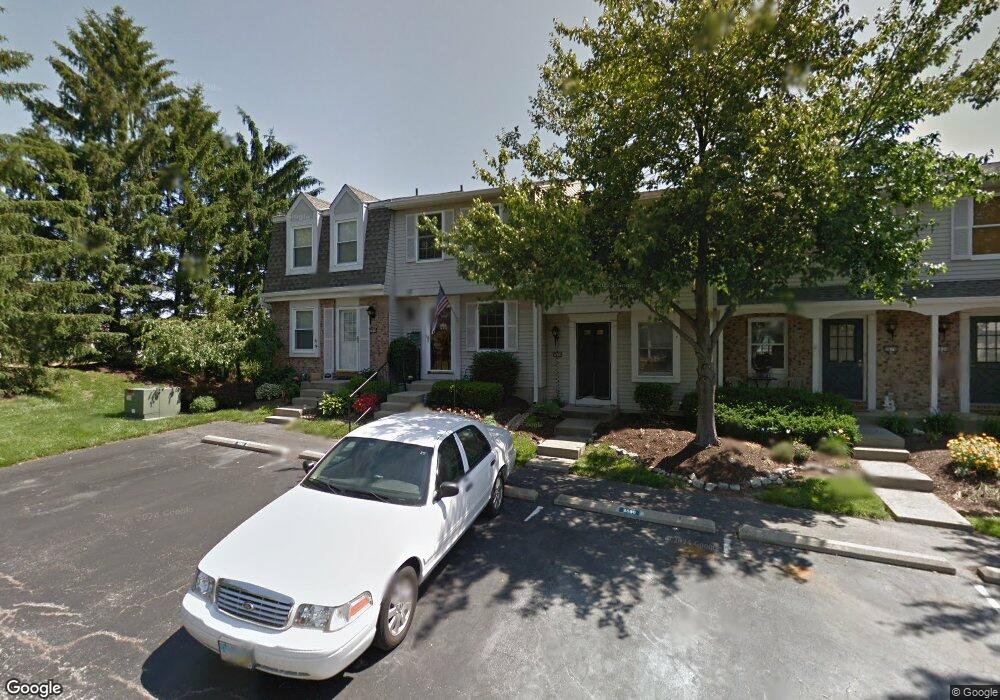
2882 Millbank Row Maineville, OH 45039
Landen NeighborhoodEstimated Value: $182,000 - $224,000
2
Beds
2
Baths
1,268
Sq Ft
$157/Sq Ft
Est. Value
About This Home
This home is located at 2882 Millbank Row, Maineville, OH 45039 and is currently estimated at $199,136, approximately $157 per square foot. 2882 Millbank Row is a home located in Warren County with nearby schools including Kings Junior High School, Kings High School, and St. Margaret of York School.
Ownership History
Date
Name
Owned For
Owner Type
Purchase Details
Closed on
May 8, 1998
Sold by
Forgie Danny R
Bought by
Mccabe Robert and Mccabe Nancy
Current Estimated Value
Home Financials for this Owner
Home Financials are based on the most recent Mortgage that was taken out on this home.
Original Mortgage
$69,400
Outstanding Balance
$13,679
Interest Rate
7.2%
Mortgage Type
FHA
Estimated Equity
$185,457
Purchase Details
Closed on
Nov 19, 1997
Sold by
Reece Mary E
Bought by
Forgie Danny R and Forgie Judith L
Home Financials for this Owner
Home Financials are based on the most recent Mortgage that was taken out on this home.
Original Mortgage
$60,750
Interest Rate
7.38%
Mortgage Type
New Conventional
Purchase Details
Closed on
May 28, 1991
Sold by
Smith Smith and Smith Cheryl K
Bought by
Hunt Hunt and Hunt Mary E
Purchase Details
Closed on
Sep 18, 1989
Sold by
Heber Gary W and Heber Tamberle
Bought by
Smith and Smith Cheryl K
Purchase Details
Closed on
Aug 2, 1984
Sold by
Ryan Homes & Inc
Bought by
Heber Heber and Heber Gary W
Purchase Details
Closed on
May 7, 1984
Sold by
Ryan Homes & Inc
Bought by
Ryan Homes & Inc.
Create a Home Valuation Report for This Property
The Home Valuation Report is an in-depth analysis detailing your home's value as well as a comparison with similar homes in the area
Home Values in the Area
Average Home Value in this Area
Purchase History
| Date | Buyer | Sale Price | Title Company |
|---|---|---|---|
| Mccabe Robert | $71,000 | -- | |
| Forgie Danny R | $67,500 | -- | |
| Hunt Hunt | $52,000 | -- | |
| Smith | $50,000 | -- | |
| Heber Heber | $45,600 | -- | |
| Ryan Homes & Inc. | -- | -- |
Source: Public Records
Mortgage History
| Date | Status | Borrower | Loan Amount |
|---|---|---|---|
| Open | Mccabe Robert | $69,400 | |
| Previous Owner | Forgie Danny R | $60,750 |
Source: Public Records
Tax History Compared to Growth
Tax History
| Year | Tax Paid | Tax Assessment Tax Assessment Total Assessment is a certain percentage of the fair market value that is determined by local assessors to be the total taxable value of land and additions on the property. | Land | Improvement |
|---|---|---|---|---|
| 2024 | $2,483 | $48,090 | $14,000 | $34,090 |
| 2023 | $1,986 | $34,555 | $4,305 | $30,250 |
| 2022 | $1,955 | $34,556 | $4,305 | $30,251 |
| 2021 | $1,635 | $34,556 | $4,305 | $30,251 |
| 2020 | $1,580 | $28,095 | $3,500 | $24,595 |
| 2019 | $1,601 | $28,095 | $3,500 | $24,595 |
| 2018 | $1,605 | $28,095 | $3,500 | $24,595 |
| 2017 | $1,573 | $24,556 | $2,979 | $21,578 |
| 2016 | $1,614 | $24,556 | $2,979 | $21,578 |
| 2015 | $1,487 | $24,556 | $2,979 | $21,578 |
| 2014 | $1,487 | $23,380 | $2,840 | $20,550 |
| 2013 | $1,490 | $28,870 | $3,500 | $25,370 |
Source: Public Records
Map
Nearby Homes
- 2898 Mossy Brink Ct Unit 19
- 2954 Mossy Brink Ct Unit 40
- 8845 Morley Place
- 2806 Millbank Row
- 8730 Exeter Place
- 8480 Island Pines Place
- 2491 Old Mill Rd
- 9530 Greenery Ct Unit 305C
- 3160 Myrtle Dr
- 8309 Marigold Ln
- 3590 Simpson Trace
- 8600 South Dr
- 2845 Columbia Trail
- 8126 Baywood Ct
- 2617 S Harbor Dr
- 9375 Winding Ln
- 3444 Cutter Ln
- 2760 Shady Locust Trail
- 2680 Columbia Trail
- 2675 Carriagegate Ln
- 2896 Millbank Row
- 2890 Millbank Row Unit 136
- 2908 Millbank Row Unit 145
- 2884 Millbank Row
- 2906 Millbank Row
- 2910 Millbank Row Unit 146
- 2904 Millbank Row
- 2902 Millbank Row Unit 142
- 2900 Millbank Row
- 2898 Millbank Row Unit 140
- 2930 Millbank Row
- 2932 Millbank Row
- 2887 Millbank Row Unit 117
- 2934 Millbank Row Unit 149
- 2864 Millbank Row Unit 130
- 2891 Millbank Row Unit 115
- 2889 Millbank Row
- 2860 Millbank Row Unit 128
- 2885 Millbank Row
- 2870 Millbank Row