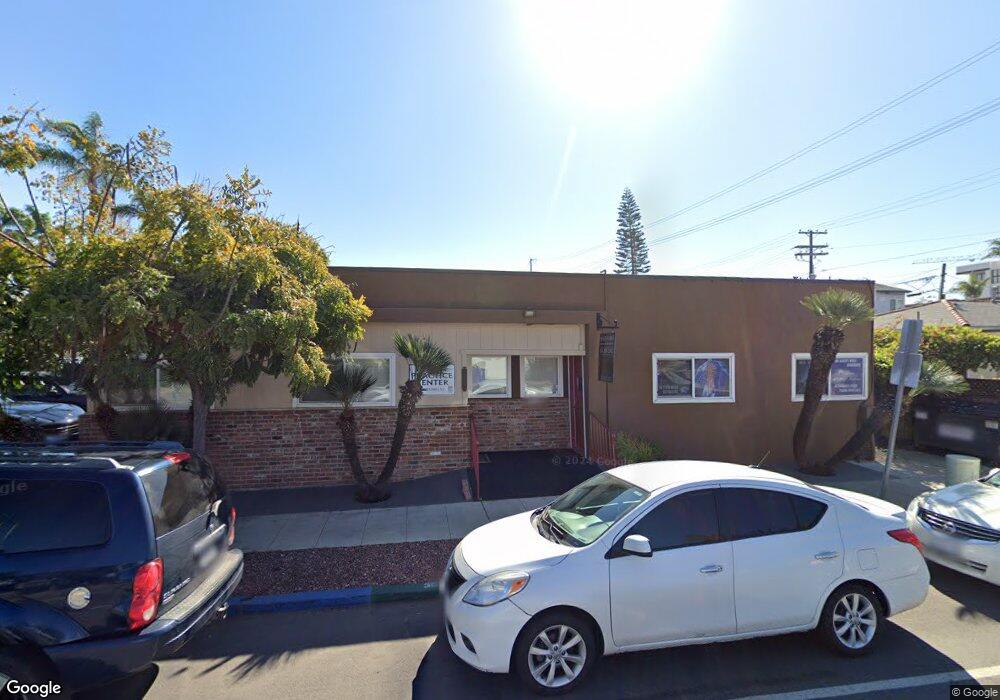
2883A 2883a Meade Ave San Diego, CA 92116
North Park NeighborhoodEstimated Value: $901,784
--
Bed
--
Bath
2,340
Sq Ft
$385/Sq Ft
Est. Value
About This Home
This home is located at 2883A 2883a Meade Ave, San Diego, CA 92116 and is currently estimated at $901,784, approximately $385 per square foot. 2883A 2883a Meade Ave is a home located in San Diego County with nearby schools including Garfield Elementary, Roosevelt International Middle School, and North Park Christian School.
Ownership History
Date
Name
Owned For
Owner Type
Purchase Details
Closed on
Sep 14, 2012
Sold by
Burton Diane Elizabeth
Bought by
Future Wellness Llc
Current Estimated Value
Home Financials for this Owner
Home Financials are based on the most recent Mortgage that was taken out on this home.
Original Mortgage
$252,500
Interest Rate
3.5%
Mortgage Type
Commercial
Purchase Details
Closed on
Oct 23, 2002
Sold by
Papas George T
Bought by
Miller William D
Purchase Details
Closed on
Aug 17, 2000
Sold by
Papas George T
Bought by
Papas George T
Purchase Details
Closed on
Nov 17, 1995
Sold by
Papas Raija Anita
Bought by
Papas George T
Home Financials for this Owner
Home Financials are based on the most recent Mortgage that was taken out on this home.
Original Mortgage
$32,500
Interest Rate
7.58%
Mortgage Type
Commercial
Purchase Details
Closed on
Jul 21, 1983
Create a Home Valuation Report for This Property
The Home Valuation Report is an in-depth analysis detailing your home's value as well as a comparison with similar homes in the area
Home Values in the Area
Average Home Value in this Area
Purchase History
| Date | Buyer | Sale Price | Title Company |
|---|---|---|---|
| Future Wellness Llc | $345,000 | Ticor Title | |
| Miller William D | $365,000 | Diversified Title & Escrow S | |
| Papas George T | -- | -- | |
| Papas George T | -- | Chicago Title Co | |
| Papas George T | -- | Chicago Title Co | |
| -- | $135,000 | -- |
Source: Public Records
Mortgage History
| Date | Status | Borrower | Loan Amount |
|---|---|---|---|
| Previous Owner | Future Wellness Llc | $252,500 | |
| Previous Owner | Papas George T | $32,500 |
Source: Public Records
Tax History Compared to Growth
Tax History
| Year | Tax Paid | Tax Assessment Tax Assessment Total Assessment is a certain percentage of the fair market value that is determined by local assessors to be the total taxable value of land and additions on the property. | Land | Improvement |
|---|---|---|---|---|
| 2025 | $5,298 | $424,834 | $246,282 | $178,552 |
| 2024 | $5,298 | $416,504 | $241,453 | $175,051 |
| 2023 | $5,177 | $408,338 | $236,719 | $171,619 |
| 2022 | $5,033 | $400,332 | $232,078 | $168,254 |
| 2021 | $4,993 | $392,483 | $227,528 | $164,955 |
| 2020 | $4,932 | $388,459 | $225,195 | $163,264 |
| 2019 | $4,844 | $380,843 | $220,780 | $160,063 |
| 2018 | $4,533 | $373,376 | $216,451 | $156,925 |
| 2017 | $4,425 | $366,056 | $212,207 | $153,849 |
| 2016 | $4,353 | $358,880 | $208,047 | $150,833 |
| 2015 | $4,288 | $353,490 | $204,922 | $148,568 |
| 2014 | $4,222 | $346,566 | $200,908 | $145,658 |
Source: Public Records
Map
Nearby Homes
- 4355 Utah St Unit 2
- 4432 Kansas St Unit C
- 4367 Idaho St Unit 5
- 4347 30th St Unit 53
- 4366 Ohio St
- 4226 Utah St
- 4381 Oregon St Unit 6
- 4473 30th St Unit 506
- 4473 30th St Unit 218
- 4473 30th St Unit 505
- 4473 30th St Unit 402
- 4153-55 Utah St
- 4205 Ohio St Unit 204
- 4205 Ohio St Unit 106
- 4119-23 Kansas
- 4074 30th St
- 4075 Idaho St Unit 2
- 4043 Utah St Unit 8
- 4043 Utah St Unit 3
- 4146 Hamilton St Unit 19
- 2883 Meade Ave
- 2877 Meade Ave
- 4384 Kansas St Unit 86
- 4378 Kansas St Unit 80
- 4370 Kansas St Unit 76
- 4404 Kansas St
- 2867 Meade Ave
- 2876 Meade Ave Unit 84
- 4368 Kansas St
- 2865 Meade Ave
- 4381 Utah St
- 4414 Kansas St Unit 12
- 4414 1/2 Kansas St
- 2919 Meade Ave
- 4391 Kansas St Unit U2
- 2915 Meade Ave
- 2900 Meade Ave Unit 4
- 2866 Meade Ave
- 4383 Kansas St
- 4383 Kansas St Unit 6