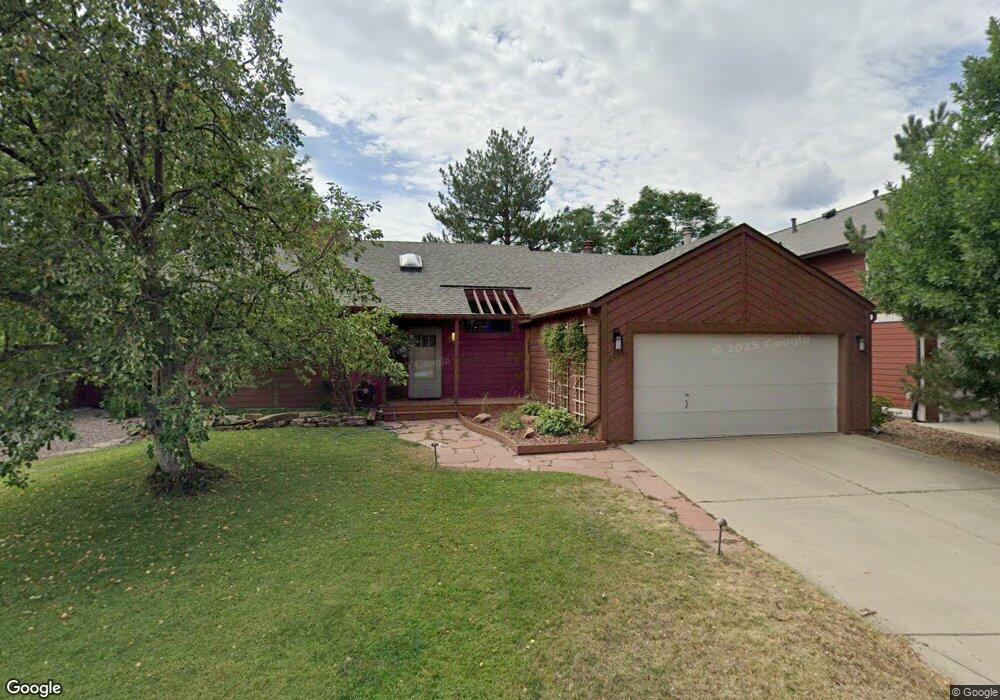
2884 Tincup Cir Boulder, CO 80305
Table Mesa NeighborhoodEstimated Value: $1,624,904 - $1,949,000
3
Beds
3
Baths
2,400
Sq Ft
$762/Sq Ft
Est. Value
About This Home
This home is located at 2884 Tincup Cir, Boulder, CO 80305 and is currently estimated at $1,828,976, approximately $762 per square foot. 2884 Tincup Cir is a home located in Boulder County with nearby schools including Mesa Elementary School, Southern Hills Middle School, and Fairview High School.
Ownership History
Date
Name
Owned For
Owner Type
Purchase Details
Closed on
Jun 13, 2011
Sold by
Wasicka Paul J
Bought by
Kitching John E
Current Estimated Value
Home Financials for this Owner
Home Financials are based on the most recent Mortgage that was taken out on this home.
Original Mortgage
$460,000
Outstanding Balance
$318,747
Interest Rate
4.74%
Mortgage Type
New Conventional
Estimated Equity
$1,510,229
Purchase Details
Closed on
Jun 15, 2007
Sold by
Rinehart Joanne Alisa and Rinehart Jody
Bought by
Wasicka Paul J
Home Financials for this Owner
Home Financials are based on the most recent Mortgage that was taken out on this home.
Original Mortgage
$636,000
Interest Rate
7.25%
Mortgage Type
New Conventional
Purchase Details
Closed on
Mar 31, 1997
Sold by
Alisa Lipp Gil and Alisa Joanne
Bought by
Rinehart Joanne Alisa
Purchase Details
Closed on
Jan 4, 1991
Bought by
Kitching John E
Purchase Details
Closed on
Dec 30, 1987
Bought by
Kitching John E
Purchase Details
Closed on
Apr 5, 1984
Bought by
Kitching John E
Create a Home Valuation Report for This Property
The Home Valuation Report is an in-depth analysis detailing your home's value as well as a comparison with similar homes in the area
Home Values in the Area
Average Home Value in this Area
Purchase History
| Date | Buyer | Sale Price | Title Company |
|---|---|---|---|
| Kitching John E | $785,000 | Land Title Guarantee Company | |
| Wasicka Paul J | $795,000 | Land Title | |
| Rinehart Joanne Alisa | -- | -- | |
| Kitching John E | -- | -- | |
| Kitching John E | -- | -- | |
| Kitching John E | $161,000 | -- |
Source: Public Records
Mortgage History
| Date | Status | Borrower | Loan Amount |
|---|---|---|---|
| Open | Kitching John E | $460,000 | |
| Previous Owner | Wasicka Paul J | $636,000 |
Source: Public Records
Tax History
| Year | Tax Paid | Tax Assessment Tax Assessment Total Assessment is a certain percentage of the fair market value that is determined by local assessors to be the total taxable value of land and additions on the property. | Land | Improvement |
|---|---|---|---|---|
| 2025 | $9,634 | $102,450 | $56,700 | $45,750 |
| 2024 | $9,634 | $102,450 | $56,700 | $45,750 |
| 2023 | $9,467 | $109,619 | $65,975 | $47,329 |
| 2022 | $8,197 | $88,265 | $51,284 | $36,981 |
| 2021 | $7,816 | $90,805 | $52,760 | $38,045 |
| 2020 | $6,780 | $77,893 | $50,408 | $27,485 |
| 2019 | $6,676 | $77,893 | $50,408 | $27,485 |
| 2018 | $6,352 | $73,260 | $48,384 | $24,876 |
| 2017 | $6,153 | $80,993 | $53,491 | $27,502 |
| 2016 | $5,663 | $65,415 | $42,029 | $23,386 |
| 2015 | $5,362 | $56,723 | $24,278 | $32,445 |
| 2014 | $4,769 | $56,723 | $24,278 | $32,445 |
Source: Public Records
Map
Nearby Homes
- 2665 Juilliard St
- 3394 Cripple Creek Trail Unit 15-H
- 3391 Cripple Creek Trail Unit E
- 3281 Cripple Creek Trail Unit 10-A
- 2596 Briarwood Dr
- 2610 Iliff St
- 3130 Kittrell Ct
- 3755 Silver Plume Ln
- 1740 Bear Mountain Dr
- 3760 Smuggler Place
- 3970 Longwood Ave
- 3210 Emerson Ave
- 3590 Endicott Dr
- 3450 Emerson Ave
- 3490 Emerson Ave
- 4100 Greenbriar Blvd
- 4204 Greenbriar Blvd Unit 45
- 4286 Greenbriar Blvd
- 2860 Table Mesa Dr
- 4380 Ludlow St
- 2854 Tincup Cir
- 2904 Tincup Cir
- 2887 Tincup Cir
- 2897 Tincup Cir
- 2877 Tincup Cir
- 2867 Tincup Cir
- 2909 Tincup Cir
- 2857 Tincup Cir
- 2944 Tincup Cir
- 2847 Tincup Cir
- 2827 Tincup Cir
- 2954 Tincup Cir
- 2837 Tincup Cir
- 2817 Tincup Cir
- 2812 Tincup Cir
- 2919 Tincup Cir
- 2964 Tincup Cir
- 2807 Tincup Cir
- 2984 Tincup Cir
- 2929 Tincup Cir
Your Personal Tour Guide
Ask me questions while you tour the home.