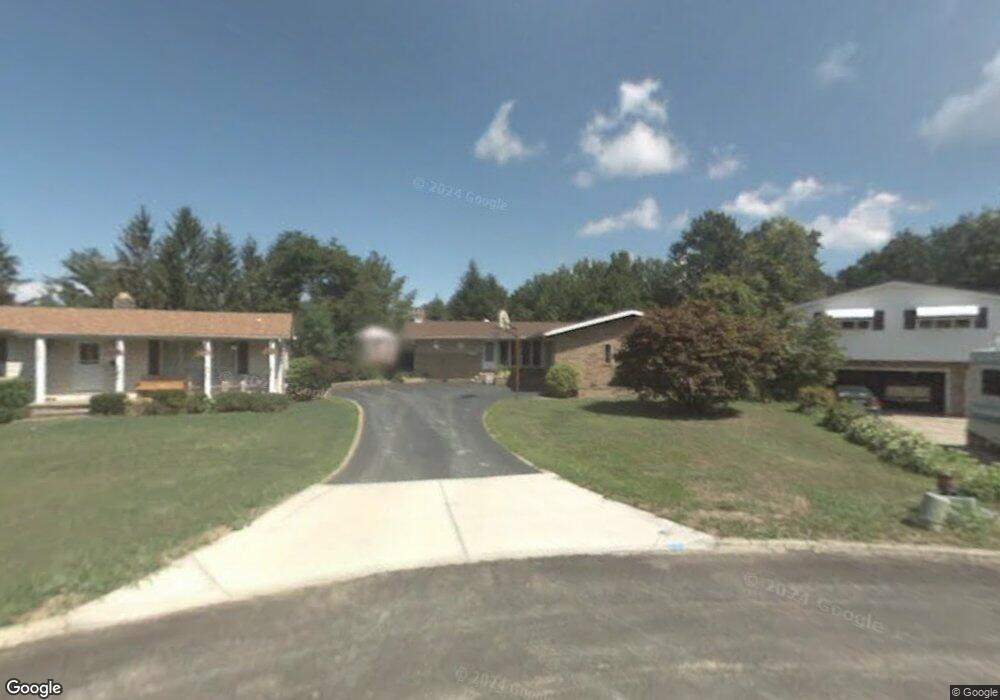
28849 Serenity Ln Wickliffe, OH 44092
Estimated Value: $248,209 - $312,000
5
Beds
3
Baths
1,606
Sq Ft
$175/Sq Ft
Est. Value
About This Home
This home is located at 28849 Serenity Ln, Wickliffe, OH 44092 and is currently estimated at $280,552, approximately $174 per square foot. 28849 Serenity Ln is a home located in Lake County with nearby schools including Wickliffe Elementary School, Wickliffe Middle School, and Wickliffe High School.
Ownership History
Date
Name
Owned For
Owner Type
Purchase Details
Closed on
Oct 10, 2008
Sold by
Joss Donald W and Joss Laura L
Bought by
Belsky Zvi and Belsky Yocheved
Current Estimated Value
Home Financials for this Owner
Home Financials are based on the most recent Mortgage that was taken out on this home.
Original Mortgage
$65,000
Outstanding Balance
$41,836
Interest Rate
5.94%
Mortgage Type
Purchase Money Mortgage
Estimated Equity
$238,716
Purchase Details
Closed on
Jun 3, 1993
Bought by
Joss Donald W
Create a Home Valuation Report for This Property
The Home Valuation Report is an in-depth analysis detailing your home's value as well as a comparison with similar homes in the area
Home Values in the Area
Average Home Value in this Area
Purchase History
| Date | Buyer | Sale Price | Title Company |
|---|---|---|---|
| Belsky Zvi | $170,000 | Precision Title Agency | |
| Joss Donald W | -- | -- |
Source: Public Records
Mortgage History
| Date | Status | Borrower | Loan Amount |
|---|---|---|---|
| Open | Belsky Zvi | $65,000 |
Source: Public Records
Tax History Compared to Growth
Tax History
| Year | Tax Paid | Tax Assessment Tax Assessment Total Assessment is a certain percentage of the fair market value that is determined by local assessors to be the total taxable value of land and additions on the property. | Land | Improvement |
|---|---|---|---|---|
| 2024 | -- | $87,770 | $22,530 | $65,240 |
| 2023 | $5,506 | $77,280 | $19,130 | $58,150 |
| 2022 | $5,544 | $77,280 | $19,130 | $58,150 |
| 2021 | $5,567 | $77,280 | $19,130 | $58,150 |
| 2020 | $5,369 | $63,340 | $15,680 | $47,660 |
| 2019 | $5,367 | $63,340 | $15,680 | $47,660 |
| 2018 | $4,174 | $52,920 | $19,370 | $33,550 |
| 2017 | $3,724 | $52,920 | $19,370 | $33,550 |
| 2016 | $3,706 | $52,920 | $19,370 | $33,550 |
| 2015 | $3,641 | $52,920 | $19,370 | $33,550 |
| 2014 | $3,207 | $52,920 | $19,370 | $33,550 |
| 2013 | $3,205 | $52,920 | $19,370 | $33,550 |
Source: Public Records
Map
Nearby Homes
- 2715 Cabin Dr
- 2253 E 290th St
- 28828 Eddy Rd
- 28862 Eddy Rd
- 0 Green Ridge Dr
- 2825 Orchard Dr
- V/L 39 Chardon Rd
- 28900 Euclid Ave
- 2603 Rockefeller Rd
- 25 Arlington Cir
- 1811 Lincoln Rd
- 1821 Lincoln Rd
- 1457 E 289th St
- 29 Arlington Cir
- Birch Plan at Old School Village
- Elder Plan at Old School Village
- Cedar Plan at Old School Village
- Aspen Plan at Old School Village
- Tupelo Plan at Old School Village
- 1670 Hillandale Dr
- 28854 Serenity Ln
- 28845 Serenity Ln
- 28852 Serenity Ln
- 28841 Serenity Ln
- 28837 Serenity Ln
- 28848 Serenity Ln
- 28840 Serenity Ln
- 28844 Serenity Ln
- 28833 Clark Dr
- 28836 Serenity Ln
- 2697 Cabin Dr
- 2693 Cabin Dr
- 2699 Cabin Dr
- 2705 Cabin Dr
- 28807 Clark Dr
- 2388 Stanford Dr
- 28800 Clark Dr
- 2398 Stanford Dr
- 2382 Stanford Dr
- 28801 Clark Dr