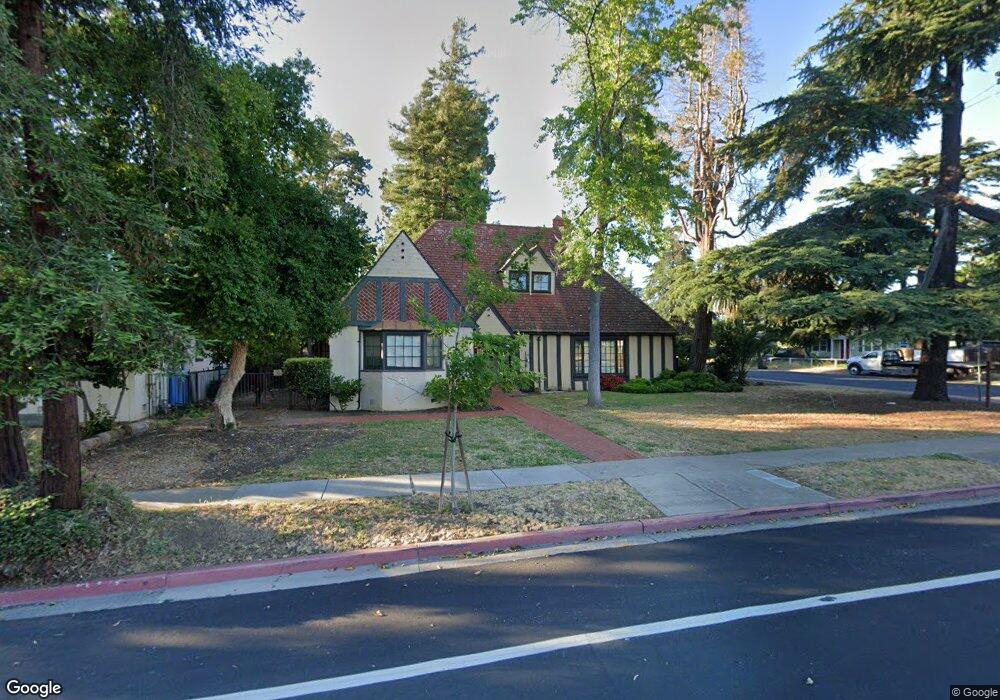
2885 Concord Blvd Concord, CA 94519
Parkside NeighborhoodEstimated Value: $1,053,792
Studio
--
Bath
3,500
Sq Ft
$301/Sq Ft
Est. Value
About This Home
This home is located at 2885 Concord Blvd, Concord, CA 94519 and is currently estimated at $1,053,792, approximately $301 per square foot. 2885 Concord Blvd is a home located in Contra Costa County with nearby schools including Wren Avenue Elementary School, El Dorado Middle School, and Mt. Diablo High School.
Ownership History
Date
Name
Owned For
Owner Type
Purchase Details
Closed on
Dec 27, 2018
Sold by
Yoo Scott and Yoo Grace
Bought by
Tgog Inc
Current Estimated Value
Purchase Details
Closed on
May 11, 2017
Sold by
Trembath James R
Bought by
Yoo Scott and Yoo Grace
Home Financials for this Owner
Home Financials are based on the most recent Mortgage that was taken out on this home.
Original Mortgage
$584,500
Interest Rate
3.95%
Mortgage Type
Commercial
Purchase Details
Closed on
May 30, 2012
Sold by
Trembath James R
Bought by
Trembath James R
Purchase Details
Closed on
Apr 17, 2007
Sold by
T & M Properties
Bought by
Trembath James R and Mccabe Michael P
Purchase Details
Closed on
Apr 13, 2007
Sold by
Trembath Joann Olvera
Bought by
Trembath James R
Create a Home Valuation Report for This Property
The Home Valuation Report is an in-depth analysis detailing your home's value as well as a comparison with similar homes in the area
Home Values in the Area
Average Home Value in this Area
Purchase History
| Date | Buyer | Sale Price | Title Company |
|---|---|---|---|
| Tgog Inc | -- | None Available | |
| Yoo Scott | $835,000 | Old Republic Title Company | |
| Trembath James R | -- | Old Republic Title Company | |
| Trembath James R | -- | Old Republic Title Company | |
| Trembath James R | -- | None Available | |
| Trembath James R | -- | Old Republic Title Company | |
| Trembath James R | -- | Old Republic Title Company |
Source: Public Records
Mortgage History
| Date | Status | Borrower | Loan Amount |
|---|---|---|---|
| Previous Owner | Yoo Scott | $584,500 |
Source: Public Records
Tax History
| Year | Tax Paid | Tax Assessment Tax Assessment Total Assessment is a certain percentage of the fair market value that is determined by local assessors to be the total taxable value of land and additions on the property. | Land | Improvement |
|---|---|---|---|---|
| 2025 | $11,689 | $948,185 | $568,913 | $379,272 |
| 2024 | $11,212 | $929,594 | $557,758 | $371,836 |
| 2023 | $11,212 | $911,368 | $546,822 | $364,546 |
| 2022 | $11,081 | $893,499 | $536,100 | $357,399 |
| 2021 | $10,827 | $875,981 | $525,589 | $350,392 |
| 2019 | $10,822 | $851,700 | $510,000 | $341,700 |
| 2018 | $10,316 | $835,000 | $500,000 | $335,000 |
| 2017 | $2,650 | $157,077 | $33,768 | $123,309 |
| 2016 | $2,557 | $153,998 | $33,106 | $120,892 |
| 2015 | $2,542 | $151,686 | $32,609 | $119,077 |
| 2014 | $3,026 | $148,716 | $31,971 | $116,745 |
Source: Public Records
Map
Nearby Homes
- 1848 Parkside Dr
- 2850 Concord Blvd
- 1861 Parkside Dr
- 2947 Concord Blvd
- 2601 Sinclair Ave Unit 6
- 2640 Wisteria Way
- 3195 Willow Pass Rd
- 3336 Euclid Ave
- 1715 Copperleaf Ct
- 3162 Salvio St
- 2251 Pacheco St
- 1385 Galindo St
- 3124 Mount Diablo St
- 2093 Mount Diablo St
- 2109 N 6th St
- 3479 Rose Ct
- 3466 Willow Pass Rd Unit 54
- 2722 Cowell Rd
- 1971 Bonifacio St Unit 3
- 1975 Bonifacio St Unit 5
- 1847 Parkside Dr
- 1832 Parkside Dr
- 1845 Parkside Dr
- 2901 Concord Blvd
- 2878 Euclid Ave
- 2869 Concord Blvd
- 2876 Euclid Ave
- 2884 Euclid Ave Unit A
- 1838 Parkside Dr
- 2907 Concord Blvd
- 2874 Euclid Ave
- 2890 Concord Blvd
- 2904 Concord Blvd
- 2913 Concord Blvd
- 2906 Concord Blvd
- 2888 Concord Blvd
- 2834 Euclid Ave
- 2906 Euclid Ave
- 2908 Concord Blvd
- 2912 Euclid Ave
Your Personal Tour Guide
Ask me questions while you tour the home.