
Seller's Agent in 2025
Kathleen Maxwell
Weybridge Realty, LLC
(812) 221-0204
6 in this area
43 Total Sales
Estimated Value: $116,000 - $133,000
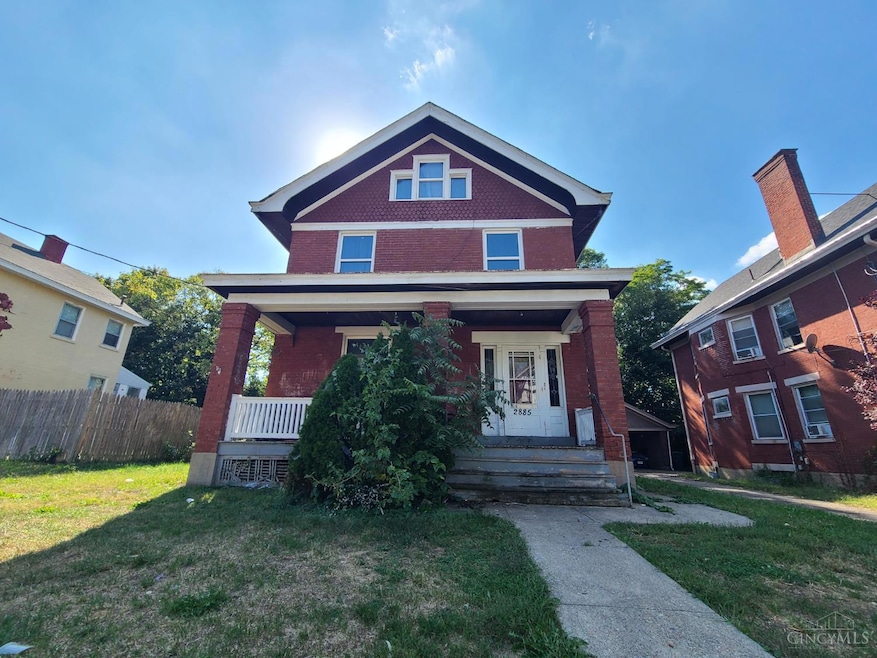
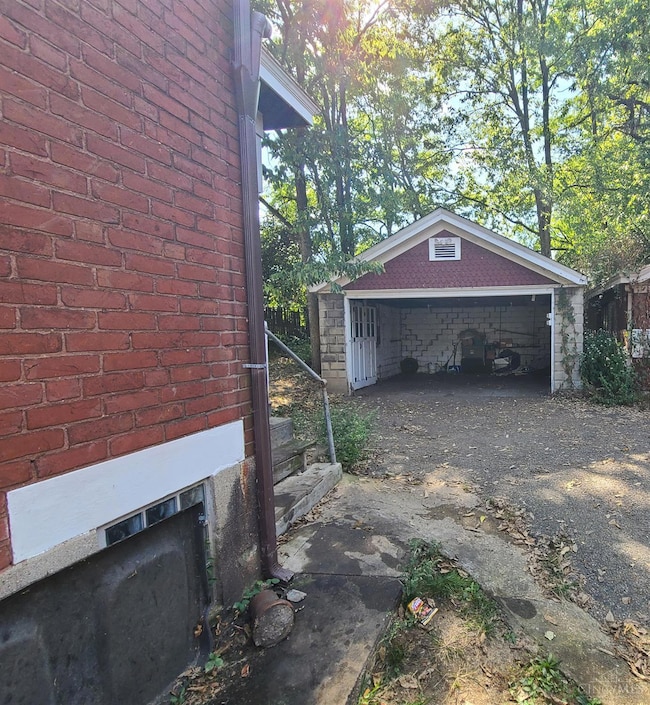
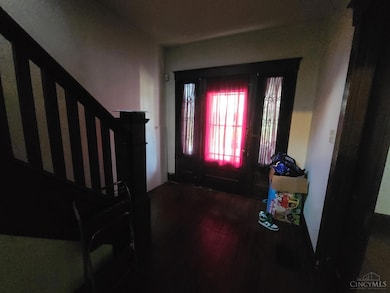
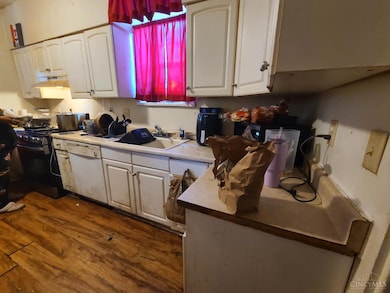
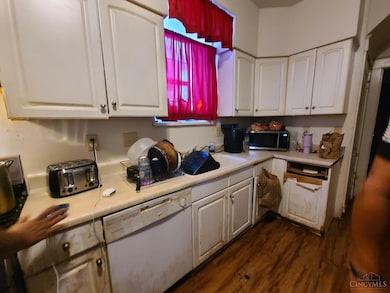
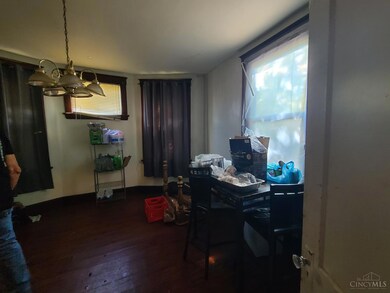
Solid brick 4 bed 2 full bath house in Westwood. Living room, formal dining room and kitchen are on the first floor. Kitchen is equipped with a stove, refrigerator and dishwasher. 3 bedrooms and 2 full baths on the second floor; 4th bedroom on top floor. Central Air. Being sold as is. Original woodwork, including pocket doors. Replacement windows installed 3/2010. Roof/soffit/gutters/downspouts (house & garage) replaced 8/2017. Water heater replaced 9/2017. Possible package deal with 749 Wilbud in West Price Hill MLS #1857718. Currently tenant occupied; 48 hour notice required for showings.
Last Agent to Sell the Property
Weybridge Realty, LLC License #2018001891 Listed on: 10/12/2025
| Date | Buyer | Sale Price | Title Company |
|---|---|---|---|
| Nestpoint Llc | $118,000 | None Listed On Document | |
| Rpo Enterprises Llc | -- | None Available | |
| Beebe Thomas M | -- | None Available | |
| Umbach Steven R | -- | -- | |
| Beebe Thomas M | $89,900 | Cambridge Land Title Agency | |
| Rechel Robert | -- | -- |
| Date | Status | Borrower | Loan Amount |
|---|---|---|---|
| Open | Nestpoint Llc | $75,000 | |
| Previous Owner | Beebe Thomas M | $64,700 | |
| Closed | Beebe Thomas M | $4,000 |
| Date | Event | Price | List to Sale | Price per Sq Ft |
|---|---|---|---|---|
| 12/01/2025 12/01/25 | Sold | $118,000 | -1.6% | $62 / Sq Ft |
| 10/17/2025 10/17/25 | Pending | -- | -- | -- |
| 10/12/2025 10/12/25 | For Sale | $119,900 | -- | $63 / Sq Ft |
| Year | Tax Paid | Tax Assessment Tax Assessment Total Assessment is a certain percentage of the fair market value that is determined by local assessors to be the total taxable value of land and additions on the property. | Land | Improvement |
|---|---|---|---|---|
| 2025 | $3,046 | $47,901 | $6,027 | $41,874 |
| 2024 | $3,042 | $47,901 | $6,027 | $41,874 |
| 2023 | $3,047 | $47,901 | $6,027 | $41,874 |
| 2022 | $1,265 | $17,766 | $4,893 | $12,873 |
| 2021 | $1,239 | $17,766 | $4,893 | $12,873 |
| 2020 | $1,243 | $17,766 | $4,893 | $12,873 |
| 2019 | $1,242 | $16,153 | $4,449 | $11,704 |
| 2018 | $1,243 | $16,153 | $4,449 | $11,704 |
| 2017 | $1,197 | $16,153 | $4,449 | $11,704 |
| 2016 | $1,447 | $19,072 | $5,166 | $13,906 |
| 2015 | $1,294 | $19,072 | $5,166 | $13,906 |
| 2014 | $1,301 | $19,072 | $5,166 | $13,906 |
| 2013 | $1,377 | $19,870 | $5,383 | $14,487 |
Seller's Agent in 2025
Kathleen Maxwell
Weybridge Realty, LLC
(812) 221-0204
6 in this area
43 Total Sales
Buyer's Agent in 2025
Denis Joseph
Real of Ohio
(513) 900-0303
5 in this area
92 Total Sales
Source: MLS of Greater Cincinnati (CincyMLS)
MLS Number: 1857736
APN: 208-0055-0041
Disclaimer: Certain information contained herein is derived from information provided by parties other than Homes.com. All information provided is deemed reliable, but is not guaranteed to be accurate and should be independently verified.
![]() The data relating to real estate for sale on this website comes in part from the Broker Reciprocity programs of the MLS of Greater Cincinnati, Inc.. Those listings held by brokerage firms other than Ten-X are marked with the Broker Reciprocity logo and house icon. The properties displayed may not be all of the properties available through Broker Reciprocity.
The data relating to real estate for sale on this website comes in part from the Broker Reciprocity programs of the MLS of Greater Cincinnati, Inc.. Those listings held by brokerage firms other than Ten-X are marked with the Broker Reciprocity logo and house icon. The properties displayed may not be all of the properties available through Broker Reciprocity.
IDX information is provided exclusively for personal, non-commercial use, and may not be used for any purpose other than to identify prospective properties consumers may be interested in purchasing.
Information is deemed reliable but not guaranteed.
Ten-X does not display the entire Cincinnati MLS Broker Reciprocity™ database on this web site. The listings of some real estate brokerage firms have been excluded.
Copyright 2026, MLS of Greater Cincinnati, Inc. All rights reserved
Ask me questions while you tour the home.