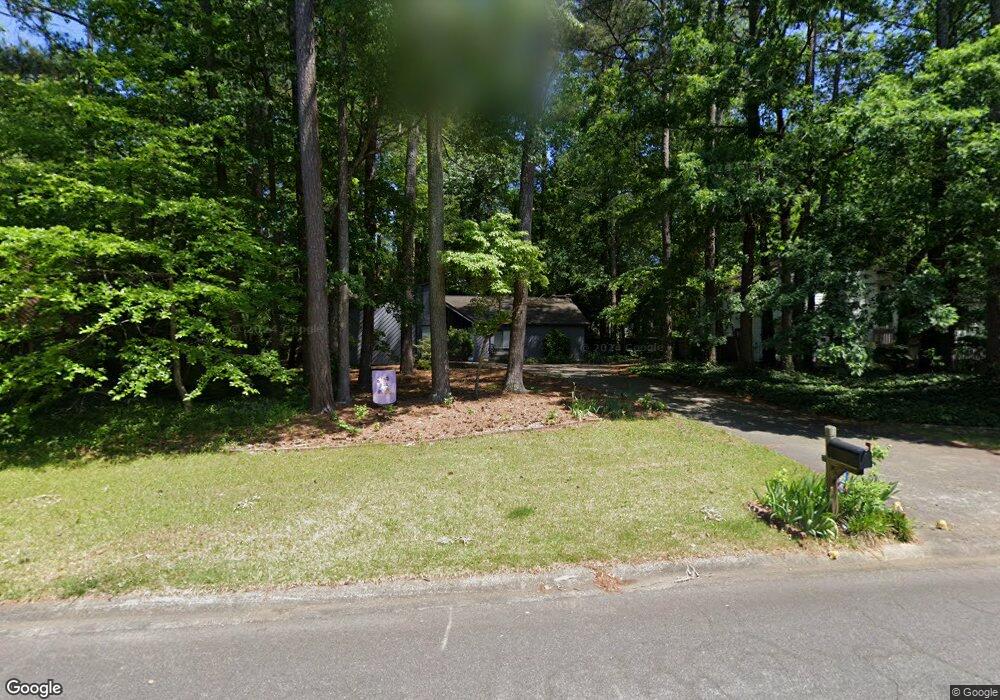
2889 Alberta Dr Marietta, GA 30062
East Cobb NeighborhoodEstimated Value: $375,531 - $401,000
3
Beds
2
Baths
1,502
Sq Ft
$259/Sq Ft
Est. Value
About This Home
This home is located at 2889 Alberta Dr, Marietta, GA 30062 and is currently estimated at $388,633, approximately $258 per square foot. 2889 Alberta Dr is a home located in Cobb County with nearby schools including Mountain View Elementary School, Simpson Middle School, and Sprayberry High School.
Ownership History
Date
Name
Owned For
Owner Type
Purchase Details
Closed on
Jun 11, 2004
Sold by
Hedlund Trevor
Bought by
Taylor Bryan L and Taylor Holly
Current Estimated Value
Home Financials for this Owner
Home Financials are based on the most recent Mortgage that was taken out on this home.
Original Mortgage
$148,200
Interest Rate
6.19%
Mortgage Type
New Conventional
Purchase Details
Closed on
Nov 28, 2001
Sold by
Cimmeron Land & Cattle Co
Bought by
Hedlund Trevor
Home Financials for this Owner
Home Financials are based on the most recent Mortgage that was taken out on this home.
Original Mortgage
$132,457
Interest Rate
6.5%
Mortgage Type
New Conventional
Purchase Details
Closed on
Feb 10, 1998
Sold by
Cardwell Robert T and Cardwell Janet L
Bought by
Cimmeron Land & Cattle Co
Create a Home Valuation Report for This Property
The Home Valuation Report is an in-depth analysis detailing your home's value as well as a comparison with similar homes in the area
Home Values in the Area
Average Home Value in this Area
Purchase History
| Date | Buyer | Sale Price | Title Company |
|---|---|---|---|
| Taylor Bryan L | $156,000 | -- | |
| Hedlund Trevor | $140,000 | -- | |
| Cimmeron Land & Cattle Co | $95,000 | -- |
Source: Public Records
Mortgage History
| Date | Status | Borrower | Loan Amount |
|---|---|---|---|
| Previous Owner | Taylor Bryan L | $148,200 | |
| Previous Owner | Hedlund Trevor | $132,457 |
Source: Public Records
Tax History Compared to Growth
Tax History
| Year | Tax Paid | Tax Assessment Tax Assessment Total Assessment is a certain percentage of the fair market value that is determined by local assessors to be the total taxable value of land and additions on the property. | Land | Improvement |
|---|---|---|---|---|
| 2025 | $3,269 | $141,220 | $34,000 | $107,220 |
| 2024 | $3,272 | $141,220 | $34,000 | $107,220 |
| 2023 | $2,213 | $117,444 | $26,000 | $91,444 |
| 2022 | $2,778 | $117,444 | $26,000 | $91,444 |
| 2021 | $2,183 | $90,292 | $26,000 | $64,292 |
| 2020 | $2,183 | $90,292 | $26,000 | $64,292 |
| 2019 | $1,963 | $80,248 | $22,000 | $58,248 |
| 2018 | $1,636 | $65,276 | $20,000 | $45,276 |
| 2017 | $1,403 | $58,032 | $14,000 | $44,032 |
| 2016 | $1,404 | $58,032 | $14,000 | $44,032 |
| 2015 | $1,410 | $56,696 | $14,000 | $42,696 |
| 2014 | $1,126 | $46,724 | $0 | $0 |
Source: Public Records
Map
Nearby Homes
- 2919 Manitoba Ln
- 3006 Alberta Dr
- 2998 Kodiak Ct
- 2422 Salem Dr NE
- 2321 Post Creek Ct
- 2607 Lulworth Ln
- 2671 Nicholas Ct NE
- 2404 Pondside Ct NE
- 2963 Timberline Rd Unit 2
- 2641 Nicholas Ct NE
- 2581 Oak Village Place NE
- 2478 Alston Dr NE
- 3060 Sandy Plains Rd
- 2747 Harper Woods Dr
- 3061 Sandy Plains Rd
- 2686 Evers Dr NE
- 2690 Evers Dr
- 2694 Evers Dr
- 1927 Redfield Rd
- 2909 Alberta Dr
- 2879 Alberta Dr
- 2980 Manitoba Ct
- 2869 Alberta Dr
- 2960 Manitoba Ln
- 2900 Alberta Dr
- 2880 Alberta Dr
- 2890 Manitoba Ct
- 2951 Alberta Dr
- 2970 Manitoba Ln
- 2859 Alberta Dr
- 2550 Alberta Ln
- 2967 Alberta Dr
- 2940 Alberta Dr
- 2980 Manitoba Ln
- 2564 Alberta Ln
- 2860 Alberta Dr
- 2879 Manitoba Ct
- 2869 Manitoba Ct
- 2929 Manitoba Ln