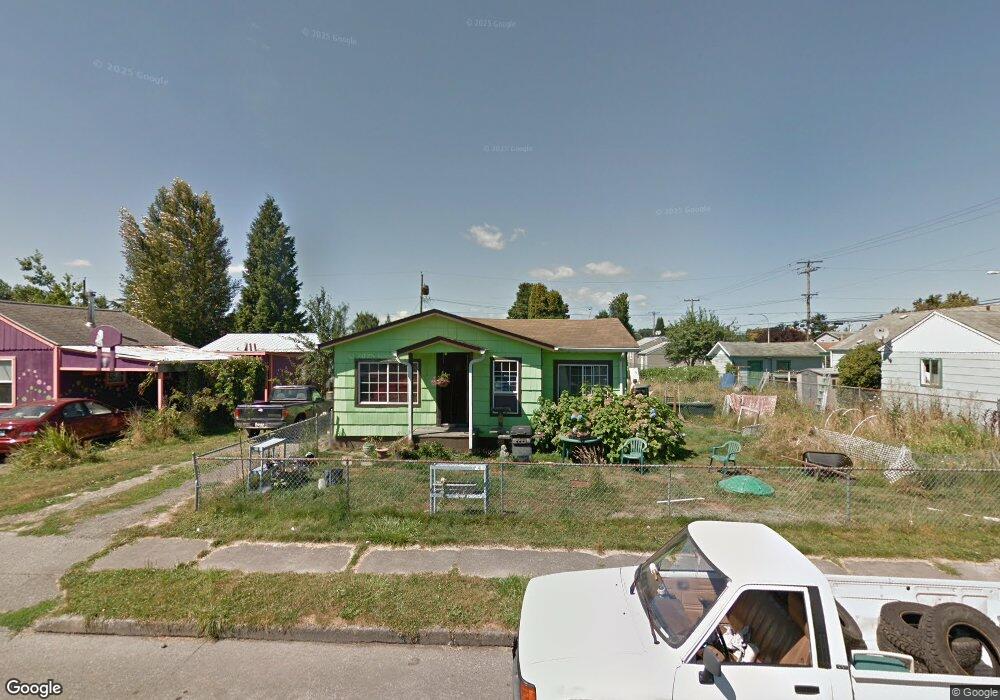
289 27th Ave Longview, WA 98632
Highlands NeighborhoodEstimated Value: $238,000 - $283,000
2
Beds
1
Bath
820
Sq Ft
$323/Sq Ft
Est. Value
About This Home
This home is located at 289 27th Ave, Longview, WA 98632 and is currently estimated at $264,978, approximately $323 per square foot. 289 27th Ave is a home located in Cowlitz County with nearby schools including Monticello Middle School, R.A. Long High School, and St. Rose School.
Ownership History
Date
Name
Owned For
Owner Type
Purchase Details
Closed on
Jan 11, 2006
Sold by
Swett Steven and Swett Frances
Bought by
Snyder Ralph G
Current Estimated Value
Home Financials for this Owner
Home Financials are based on the most recent Mortgage that was taken out on this home.
Original Mortgage
$36,600
Outstanding Balance
$20,633
Interest Rate
6.32%
Mortgage Type
Fannie Mae Freddie Mac
Estimated Equity
$244,345
Purchase Details
Closed on
Oct 1, 2001
Sold by
Erckenbrack Clinton and Erckenbrack Nancy
Bought by
Swett Steven and Swett Francis
Create a Home Valuation Report for This Property
The Home Valuation Report is an in-depth analysis detailing your home's value as well as a comparison with similar homes in the area
Home Values in the Area
Average Home Value in this Area
Purchase History
| Date | Buyer | Sale Price | Title Company |
|---|---|---|---|
| Snyder Ralph G | $40,700 | Chicago Title Ins | |
| Swett Steven | -- | Chicago Title Ins |
Source: Public Records
Mortgage History
| Date | Status | Borrower | Loan Amount |
|---|---|---|---|
| Open | Snyder Ralph G | $36,600 |
Source: Public Records
Tax History
| Year | Tax Paid | Tax Assessment Tax Assessment Total Assessment is a certain percentage of the fair market value that is determined by local assessors to be the total taxable value of land and additions on the property. | Land | Improvement |
|---|---|---|---|---|
| 2024 | $2,072 | $238,630 | $32,250 | $206,380 |
| 2023 | $698 | $79,630 | $32,250 | $47,380 |
| 2022 | $838 | $81,570 | $32,250 | $49,320 |
| 2021 | $950 | $83,520 | $32,250 | $51,270 |
| 2020 | $836 | $85,450 | $32,250 | $53,200 |
| 2019 | $855 | $78,810 | $24,810 | $54,000 |
| 2018 | $833 | $78,810 | $24,810 | $54,000 |
| 2017 | $763 | $63,070 | $23,630 | $39,440 |
| 2016 | $733 | $58,930 | $22,500 | $36,430 |
| 2015 | $798 | $57,960 | $22,500 | $35,460 |
| 2013 | -- | $58,130 | $22,500 | $35,630 |
Source: Public Records
Map
Nearby Homes
Your Personal Tour Guide
Ask me questions while you tour the home.