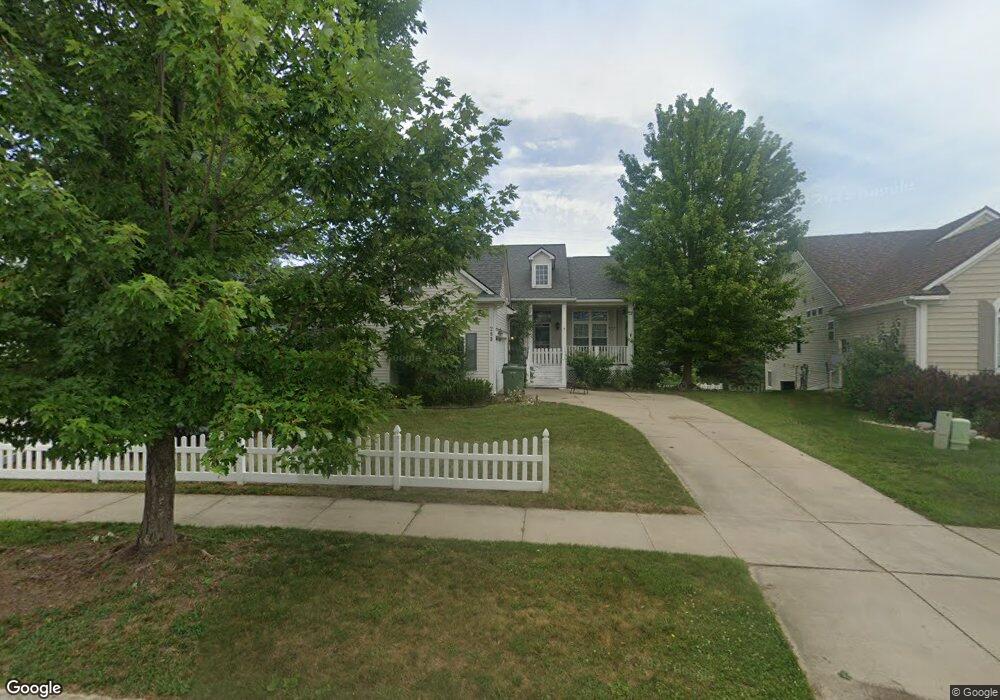
289 Atlantis Cir Unit 107 Oxford, MI 48371
Estimated Value: $410,465 - $483,000
4
Beds
4
Baths
1,801
Sq Ft
$245/Sq Ft
Est. Value
About This Home
This home is located at 289 Atlantis Cir Unit 107, Oxford, MI 48371 and is currently estimated at $440,616, approximately $244 per square foot. 289 Atlantis Cir Unit 107 is a home located in Oakland County with nearby schools including Oxford Elementary School, Daniel Axford Elementary School, and Oxford Middle School.
Ownership History
Date
Name
Owned For
Owner Type
Purchase Details
Closed on
Sep 10, 2014
Sold by
Williams Philip Neil and Williams Sarah A
Bought by
Williams Philip Neil
Current Estimated Value
Home Financials for this Owner
Home Financials are based on the most recent Mortgage that was taken out on this home.
Original Mortgage
$157,700
Outstanding Balance
$120,417
Interest Rate
4.07%
Mortgage Type
New Conventional
Estimated Equity
$320,199
Purchase Details
Closed on
Jun 29, 2010
Sold by
Beach Tanja U and Beach Tab A
Bought by
Williams Philip Neil and Williams James Mark
Purchase Details
Closed on
May 27, 2005
Sold by
Delcor Homes Oxford I Ltd
Bought by
Beach Tab A and Beach Tanja U
Home Financials for this Owner
Home Financials are based on the most recent Mortgage that was taken out on this home.
Original Mortgage
$41,700
Interest Rate
5.91%
Mortgage Type
Stand Alone Second
Create a Home Valuation Report for This Property
The Home Valuation Report is an in-depth analysis detailing your home's value as well as a comparison with similar homes in the area
Home Values in the Area
Average Home Value in this Area
Purchase History
| Date | Buyer | Sale Price | Title Company |
|---|---|---|---|
| Williams Philip Neil | -- | None Available | |
| Williams Philip Neil | $170,000 | Troy Abstract & Title Agency | |
| Beach Tab A | $278,000 | Metropolitan Title Company |
Source: Public Records
Mortgage History
| Date | Status | Borrower | Loan Amount |
|---|---|---|---|
| Open | Williams Philip Neil | $157,700 | |
| Previous Owner | Beach Tab A | $41,700 | |
| Previous Owner | Beach Tab A | $222,400 |
Source: Public Records
Tax History Compared to Growth
Tax History
| Year | Tax Paid | Tax Assessment Tax Assessment Total Assessment is a certain percentage of the fair market value that is determined by local assessors to be the total taxable value of land and additions on the property. | Land | Improvement |
|---|---|---|---|---|
| 2024 | $2,463 | $193,810 | $0 | $0 |
| 2023 | $2,349 | $164,440 | $0 | $0 |
| 2022 | $3,867 | $152,040 | $0 | $0 |
| 2021 | $3,666 | $144,880 | $0 | $0 |
| 2020 | $2,219 | $141,640 | $0 | $0 |
| 2019 | $3,243 | $133,730 | $0 | $0 |
| 2018 | $3,181 | $128,730 | $0 | $0 |
| 2017 | $3,244 | $128,370 | $0 | $0 |
| 2016 | $3,050 | $126,480 | $0 | $0 |
| 2015 | -- | $120,070 | $0 | $0 |
| 2014 | -- | $107,670 | $0 | $0 |
| 2011 | -- | $81,070 | $0 | $0 |
Source: Public Records
Map
Nearby Homes
- 1172 Fountain View Ln Unit 72
- 682 Westlake Ave
- 372 Overlook Dr
- 622 Westlake Ave
- 720 Marlayna Dr
- 778 W Peninsula Ct
- 587 Eastlake Trail
- 302 Tanview Dr
- 822 Westlake Ave
- 254 Cross Timbers St
- 65 1st St
- 1611 Harwood Dr
- 1858 Sandy Shores Dr
- 994 Chelsea Blvd
- 35 West St
- 1904 Sandy Shores Dr
- 224 Stony Lake Dr Unit 57
- 1974 Sandy Shores Dr
- 227 Ora Rd
- 1170 Glass Lake Cir
- 299 Atlantis Cir Unit 108
- 281 Atlantis Cir Unit 106
- 269 Atlantis Cir Unit 105
- 309 Atlantis Cir Unit 109
- 290 Atlantis Cir Unit 111
- 319 Atlantis Cir Unit 110
- 259 Atlantis Cir Unit 104
- 270 Atlantis Cir Unit 112
- 1455 Fountain View Ln
- 251 Atlantis Cir Unit 103
- 1465 Fountain View Ln Unit 122
- 250 Atlantis Cir
- 1475 Fountain View Ln Unit 123
- 1445 Fountain View Ln Unit 120
- 1435 Fountain View Ln Unit 119
- 243 Atlantis Cir
- 1485 Fountain View Ln Unit 124
- 235 Atlantis Cir Unit 101
- 214 Atlantis Cir Unit 115
- 1425 Fountain View Ln