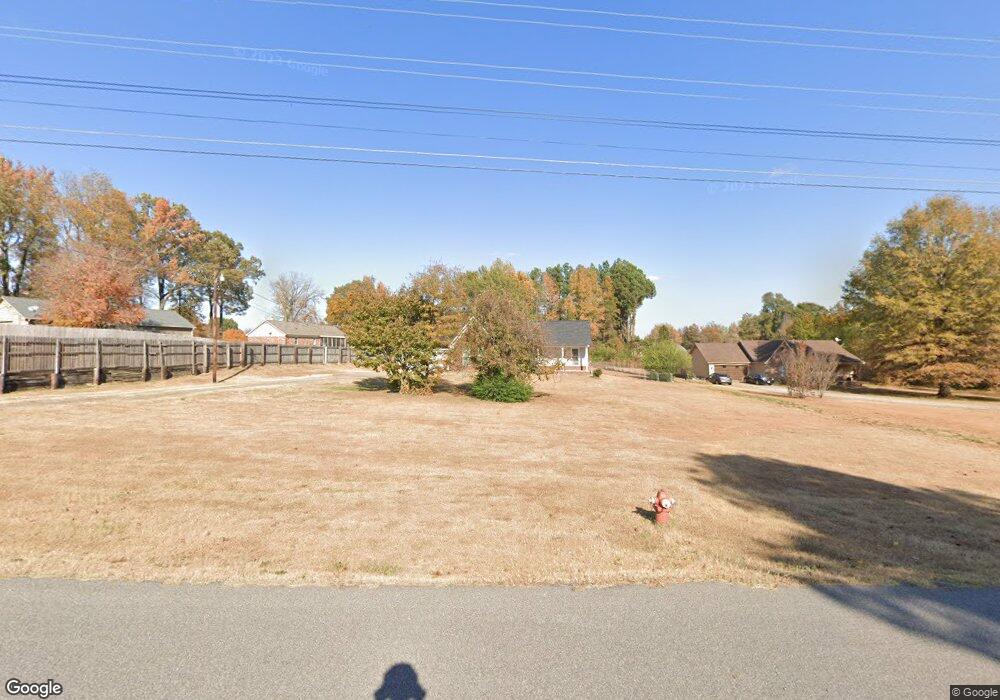
289 Cherokee Rd Millington, TN 38053
Estimated Value: $223,000 - $275,000
--
Bed
2
Baths
1,337
Sq Ft
$180/Sq Ft
Est. Value
About This Home
This home is located at 289 Cherokee Rd, Millington, TN 38053 and is currently estimated at $240,586, approximately $179 per square foot. 289 Cherokee Rd is a home located in Tipton County with nearby schools including Atoka Elementary School, Munford Middle School, and Munford High School.
Ownership History
Date
Name
Owned For
Owner Type
Purchase Details
Closed on
Mar 21, 2022
Sold by
Chris Howard Phillip
Bought by
Howard Phillip Chris and Howard Christin R
Current Estimated Value
Home Financials for this Owner
Home Financials are based on the most recent Mortgage that was taken out on this home.
Original Mortgage
$64,770
Outstanding Balance
$20,595
Interest Rate
3.39%
Mortgage Type
New Conventional
Estimated Equity
$219,991
Purchase Details
Closed on
Mar 25, 2021
Sold by
Travis Vicki M and Murchison Gary
Bought by
Howard Philip Chris
Home Financials for this Owner
Home Financials are based on the most recent Mortgage that was taken out on this home.
Original Mortgage
$112,115
Interest Rate
2.8%
Mortgage Type
Future Advance Clause Open End Mortgage
Purchase Details
Closed on
Dec 4, 1995
Bought by
Murchison Wilma W
Purchase Details
Closed on
Sep 21, 1994
Bought by
Berford Travis R and Berford Doris R
Purchase Details
Closed on
Mar 20, 1989
Bought by
Ballard Wayne and Ballard Peggy
Create a Home Valuation Report for This Property
The Home Valuation Report is an in-depth analysis detailing your home's value as well as a comparison with similar homes in the area
Home Values in the Area
Average Home Value in this Area
Purchase History
| Date | Buyer | Sale Price | Title Company |
|---|---|---|---|
| Howard Phillip Chris | -- | Fayette County Title | |
| Howard Philip Chris | $100,000 | Closetrak Closing & Ttl Svcs | |
| Murchison Wilma W | $75,000 | -- | |
| Berford Travis R | $16,600 | -- | |
| Ballard Wayne | -- | -- |
Source: Public Records
Mortgage History
| Date | Status | Borrower | Loan Amount |
|---|---|---|---|
| Open | Howard Phillip Chris | $64,770 | |
| Previous Owner | Howard Philip Chris | $112,115 |
Source: Public Records
Tax History Compared to Growth
Tax History
| Year | Tax Paid | Tax Assessment Tax Assessment Total Assessment is a certain percentage of the fair market value that is determined by local assessors to be the total taxable value of land and additions on the property. | Land | Improvement |
|---|---|---|---|---|
| 2024 | $767 | $50,425 | $7,300 | $43,125 |
| 2023 | $767 | $50,425 | $7,300 | $43,125 |
| 2022 | $721 | $35,325 | $5,375 | $29,950 |
| 2021 | $721 | $35,325 | $5,375 | $29,950 |
| 2020 | $720 | $35,325 | $5,375 | $29,950 |
| 2019 | $708 | $29,250 | $5,000 | $24,250 |
| 2018 | $708 | $29,250 | $5,000 | $24,250 |
| 2017 | $708 | $29,250 | $5,000 | $24,250 |
| 2016 | $708 | $29,250 | $5,000 | $24,250 |
| 2015 | $707 | $29,250 | $5,000 | $24,250 |
| 2014 | $707 | $29,255 | $0 | $0 |
Source: Public Records
Map
Nearby Homes
- 153 Ash Rene Dr
- 9700 N Helene Cove
- 595 Hickory Ln
- 256 Azalea Dr
- 0 Hickory Ln
- 95 Wallace Cove
- 0 Simmons Rd Unit 10197057
- 321 Switchgrass Cove
- Spencer Plan at The Villages of Green Meadows
- Bennett Plan at The Villages of Green Meadows
- Miller Plan at The Villages of Green Meadows
- Beckett Plan at The Villages of Green Meadows
- Arbor Plan at The Villages of Green Meadows
- Carver Plan at The Villages of Green Meadows
- Carson Plan at The Villages of Green Meadows
- Aspen Plan at The Villages of Green Meadows
- Cooper Plan at The Villages of Green Meadows
- Nelson Plan at The Villages of Green Meadows
- 33 Rose Bush St
- 39 Rose Bush St
- 313 Cherokee Rd
- 63 Comanche Dr
- 83 Comanche Dr
- 195 Cherokee Rd
- 103 Comanche Dr
- 343 Cherokee Rd
- 258 Cherokee Rd
- 80 Navaho Cove
- 117 Comanche Dr
- 369 Cherokee Rd
- 208 Cherokee Rd
- 328 Cherokee Rd
- 92 Navaho Cove
- 50 Navaho Cove
- 375 Cherokee Rd
- 96 Navaho Cove
- 3979 Meade Lake Rd
- 24 Comanche Dr
- 62 Comanche Dr
- 184 Cherokee Rd