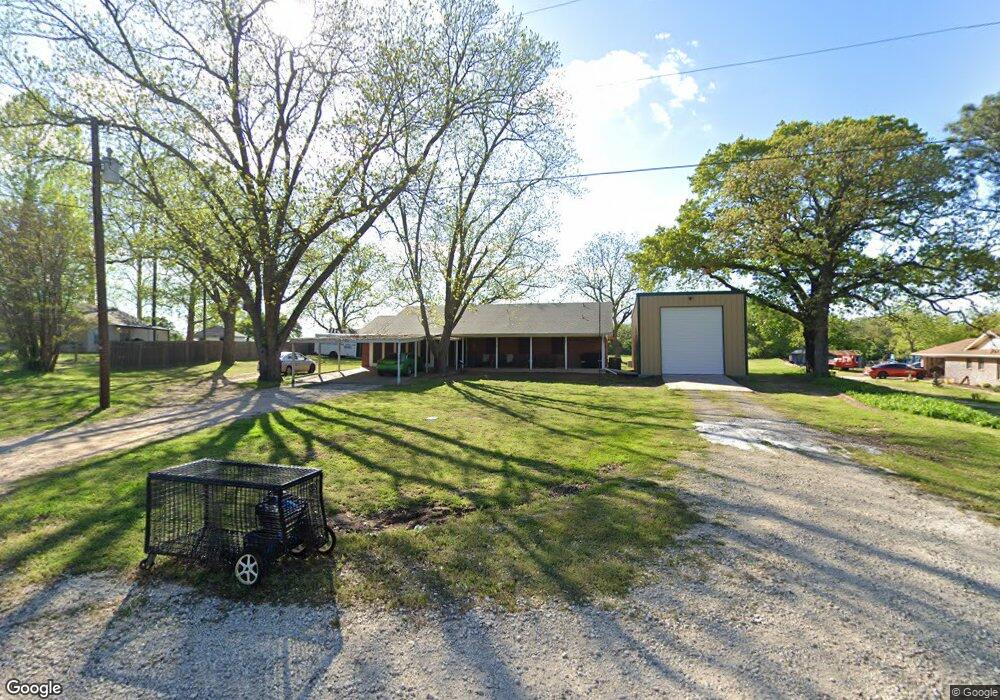
289 Coe Rd Denison, TX 75021
Estimated Value: $276,000 - $303,531
3
Beds
3
Baths
1,756
Sq Ft
$165/Sq Ft
Est. Value
About This Home
This home is located at 289 Coe Rd, Denison, TX 75021 and is currently estimated at $289,766, approximately $165 per square foot. 289 Coe Rd is a home located in Grayson County with nearby schools including Lamar Elementary School, Scott Middle School, and Denison High School.
Ownership History
Date
Name
Owned For
Owner Type
Purchase Details
Closed on
Jun 16, 2009
Sold by
Relocation Advantage Llc
Bought by
Korioth Wesley T and Korioth Geneva A
Current Estimated Value
Home Financials for this Owner
Home Financials are based on the most recent Mortgage that was taken out on this home.
Original Mortgage
$112,917
Outstanding Balance
$71,611
Interest Rate
4.84%
Mortgage Type
FHA
Estimated Equity
$218,155
Purchase Details
Closed on
Jun 1, 2009
Sold by
Sneed Bobby Farron and Sneed Rebekah L
Bought by
Relocation Advantage Llc
Home Financials for this Owner
Home Financials are based on the most recent Mortgage that was taken out on this home.
Original Mortgage
$112,917
Outstanding Balance
$71,611
Interest Rate
4.84%
Mortgage Type
FHA
Estimated Equity
$218,155
Purchase Details
Closed on
Aug 10, 2005
Sold by
Sneed Bobby Farron
Bought by
Sneed Bobby Farron and Sneed Rebekah L
Home Financials for this Owner
Home Financials are based on the most recent Mortgage that was taken out on this home.
Original Mortgage
$119,814
Interest Rate
5.61%
Mortgage Type
FHA
Create a Home Valuation Report for This Property
The Home Valuation Report is an in-depth analysis detailing your home's value as well as a comparison with similar homes in the area
Home Values in the Area
Average Home Value in this Area
Purchase History
| Date | Buyer | Sale Price | Title Company |
|---|---|---|---|
| Korioth Wesley T | -- | Chapin Title Co Inc | |
| Relocation Advantage Llc | -- | Chapin Title Co Inc | |
| Sneed Bobby Farron | -- | -- |
Source: Public Records
Mortgage History
| Date | Status | Borrower | Loan Amount |
|---|---|---|---|
| Open | Korioth Wesley T | $112,917 | |
| Previous Owner | Sneed Bobby Farron | $119,814 |
Source: Public Records
Tax History
| Year | Tax Paid | Tax Assessment Tax Assessment Total Assessment is a certain percentage of the fair market value that is determined by local assessors to be the total taxable value of land and additions on the property. | Land | Improvement |
|---|---|---|---|---|
| 2025 | $2,411 | $255,187 | -- | -- |
| 2024 | $3,747 | $231,988 | $0 | $0 |
| 2023 | $2,083 | $210,898 | $0 | $0 |
| 2022 | $3,313 | $191,725 | $0 | $0 |
| 2021 | $3,268 | $174,788 | $40,075 | $134,713 |
| 2020 | $3,154 | $158,450 | $23,945 | $134,505 |
| 2019 | $3,311 | $164,703 | $23,628 | $141,075 |
| 2018 | $3,042 | $141,708 | $20,064 | $121,644 |
| 2017 | $3,007 | $139,200 | $20,486 | $118,714 |
| 2016 | $2,947 | $136,393 | $16,632 | $119,761 |
Source: Public Records
Map
Nearby Homes
- 1846 Richerson Rd
- 2757 Fm 1753
- TBD NE Fm 1753 & Singletree
- 1838 Richerson Rd
- Vacant Land Ledbetter Ln
- TBD Ledbetter Ln
- TBD Singletree Rd
- TBD E Fm 120
- 5.92 Rd
- 194 Middle Rd
- 40 Cumberland Cir
- 566 Mccraw Ln
- 492 Richerson Rd
- TBD Johnson Rd
- 1549 Starr Rd
- 230 Frosty Hollow Rd
- TBD Cross Timber Estates Dr
- 1912 E Texas St
- 21 Chaparral Estates Dr
- TBD N Highway 69
Your Personal Tour Guide
Ask me questions while you tour the home.