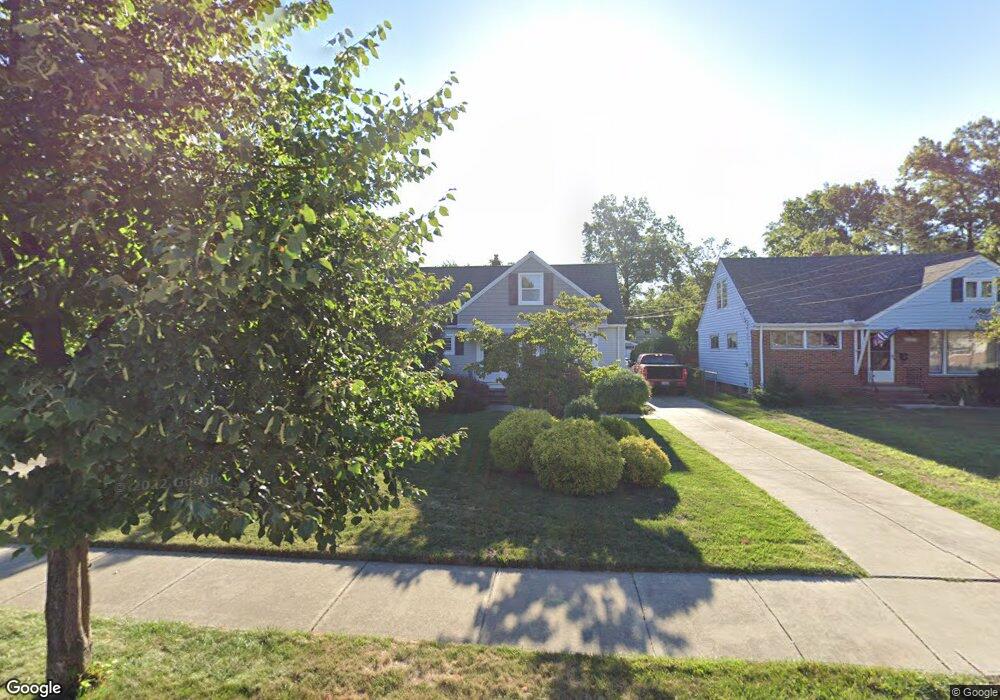
289 E 280th St Euclid, OH 44132
Estimated Value: $161,000 - $173,604
2
Beds
1
Bath
1,482
Sq Ft
$113/Sq Ft
Est. Value
About This Home
This home is located at 289 E 280th St, Euclid, OH 44132 and is currently estimated at $167,401, approximately $112 per square foot. 289 E 280th St is a home located in Cuyahoga County with nearby schools including Shoreview Elementary School, Euclid High School, and Mater Dei Academy.
Ownership History
Date
Name
Owned For
Owner Type
Purchase Details
Closed on
Oct 3, 2005
Sold by
Tarasco Louis C and Tarasco Linda
Bought by
Tarasco Louis C and Tarasco Linda
Current Estimated Value
Home Financials for this Owner
Home Financials are based on the most recent Mortgage that was taken out on this home.
Original Mortgage
$105,000
Interest Rate
5.41%
Mortgage Type
New Conventional
Purchase Details
Closed on
May 31, 1990
Sold by
Cefaratti Michael J
Bought by
Tarasco Louis C
Purchase Details
Closed on
Jan 25, 1982
Sold by
Kubea Joseph R
Bought by
Cefaratti Michael J
Purchase Details
Closed on
May 15, 1979
Sold by
Madge Lucille R
Bought by
Kubea Joseph R
Purchase Details
Closed on
Dec 14, 1977
Sold by
Kaim Carolyn F
Bought by
Madge Lucille R
Purchase Details
Closed on
Aug 24, 1976
Sold by
Kaim Frank A and Kaim Carolyn F
Bought by
Kaim Carolyn F
Purchase Details
Closed on
Jan 1, 1975
Bought by
Kaim Frank A and Kaim Carolyn F
Create a Home Valuation Report for This Property
The Home Valuation Report is an in-depth analysis detailing your home's value as well as a comparison with similar homes in the area
Home Values in the Area
Average Home Value in this Area
Purchase History
| Date | Buyer | Sale Price | Title Company |
|---|---|---|---|
| Tarasco Louis C | -- | Os Title | |
| Tarasco Louis C | $77,000 | -- | |
| Cefaratti Michael J | $61,000 | -- | |
| Kubea Joseph R | $55,000 | -- | |
| Madge Lucille R | $50,500 | -- | |
| Kaim Carolyn F | -- | -- | |
| Kaim Frank A | -- | -- |
Source: Public Records
Mortgage History
| Date | Status | Borrower | Loan Amount |
|---|---|---|---|
| Closed | Tarasco Louis C | $105,000 |
Source: Public Records
Tax History
| Year | Tax Paid | Tax Assessment Tax Assessment Total Assessment is a certain percentage of the fair market value that is determined by local assessors to be the total taxable value of land and additions on the property. | Land | Improvement |
|---|---|---|---|---|
| 2025 | $3,415 | $51,415 | $11,585 | $39,830 |
| 2024 | $3,527 | $51,415 | $11,585 | $39,830 |
| 2023 | $3,221 | $37,420 | $8,790 | $28,630 |
| 2022 | $3,147 | $37,420 | $8,790 | $28,630 |
| 2021 | $3,508 | $37,420 | $8,790 | $28,630 |
| 2020 | $3,324 | $32,240 | $7,560 | $24,680 |
| 2019 | $2,990 | $92,100 | $21,600 | $70,500 |
| 2018 | $2,919 | $32,240 | $7,560 | $24,680 |
| 2017 | $3,061 | $27,270 | $6,270 | $21,000 |
| 2016 | $3,068 | $27,270 | $6,270 | $21,000 |
| 2015 | $2,791 | $27,270 | $6,270 | $21,000 |
| 2014 | $2,791 | $27,270 | $6,270 | $21,000 |
Source: Public Records
Map
Nearby Homes
- 295 E 276th St
- 218 Wells Ct
- 28507 Lakeshore Blvd
- 427 E 275th St
- 406 E 274th St
- 625 Lloyd Rd
- 29616 Grand Blvd
- 174 E 286th St
- 257 E 270th St
- 375 Beechwood Dr
- 298 E 270th St
- 29690 Franklin Ave
- 28759 Forest Rd
- 411 E 270th St
- 29008 Uxbridge Dr
- 440 E 271st St
- 29007 Uxbridge Dr
- 953 Bryn Mawr Ave
- 940 Talmadge Ave
- 325 E 264th St
- 285 E 280th St
- 293 E 280th St
- 297 E 280th St
- 279 E 280th St
- 273 E 280th St
- 301 E 280th St
- 260 E 280th St
- 256 E 280th St
- 305 E 280th St
- 264 E 280th St
- 28302 Forest Rd
- 268 E 280th St
- 28303 Forest Rd
- 250 E 280th St
- 309 E 280th St
- 251 E 280th St
- 300 E 280th St
- 28308 Forest Rd
- 28309 Forest Rd
- 242 E 280th St
Your Personal Tour Guide
Ask me questions while you tour the home.