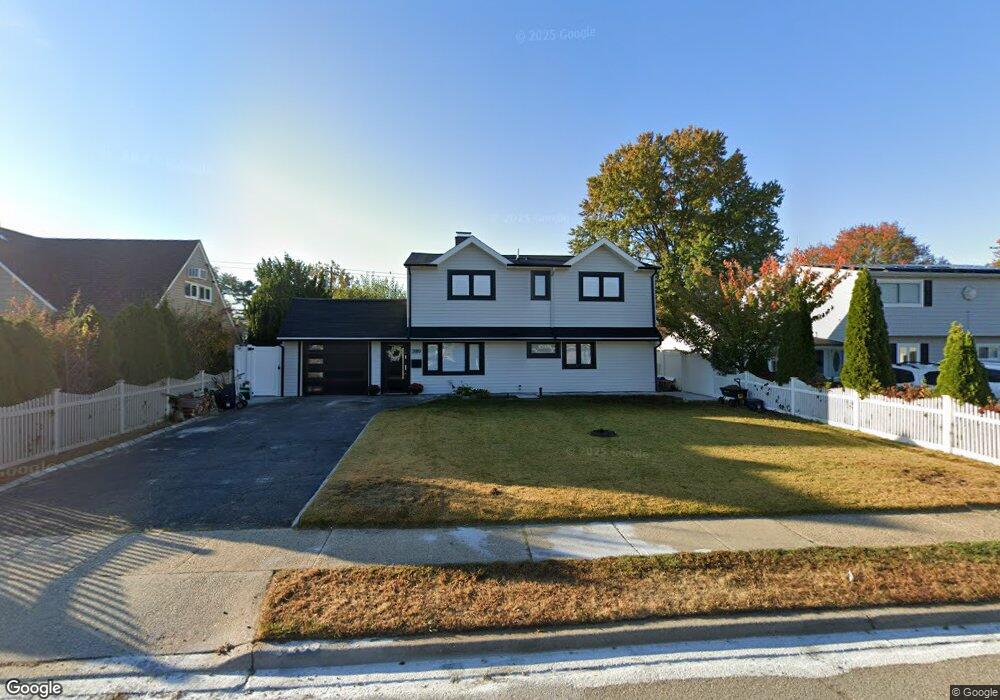
289 Elm Dr S Levittown, NY 11756
Estimated Value: $624,000 - $726,628
4
Beds
2
Baths
1,410
Sq Ft
$479/Sq Ft
Est. Value
About This Home
This home is located at 289 Elm Dr S, Levittown, NY 11756 and is currently estimated at $675,314, approximately $478 per square foot. 289 Elm Dr S is a home located in Nassau County with nearby schools including East Broadway School, Jonas E. Salk Middle School, and Gen. Douglas MacArthur Senior High School.
Ownership History
Date
Name
Owned For
Owner Type
Purchase Details
Closed on
Jun 17, 2022
Sold by
Harris Bruce C and Harris Lisa N
Bought by
Jakubowicz Krzysztof and Lasica Nicole
Current Estimated Value
Home Financials for this Owner
Home Financials are based on the most recent Mortgage that was taken out on this home.
Original Mortgage
$543,400
Outstanding Balance
$517,047
Interest Rate
5.27%
Mortgage Type
New Conventional
Estimated Equity
$158,267
Purchase Details
Closed on
Dec 15, 2021
Sold by
Nassau County Referee
Bought by
Harris Bruce C and Harris Lisa N
Create a Home Valuation Report for This Property
The Home Valuation Report is an in-depth analysis detailing your home's value as well as a comparison with similar homes in the area
Home Values in the Area
Average Home Value in this Area
Purchase History
| Date | Buyer | Sale Price | Title Company |
|---|---|---|---|
| Jakubowicz Krzysztof | $572,000 | Judicial Title | |
| Harris Bruce C | $523,460 | None Available |
Source: Public Records
Mortgage History
| Date | Status | Borrower | Loan Amount |
|---|---|---|---|
| Open | Jakubowicz Krzysztof | $543,400 |
Source: Public Records
Tax History Compared to Growth
Tax History
| Year | Tax Paid | Tax Assessment Tax Assessment Total Assessment is a certain percentage of the fair market value that is determined by local assessors to be the total taxable value of land and additions on the property. | Land | Improvement |
|---|---|---|---|---|
| 2025 | $13,448 | $412 | $213 | $199 |
| 2024 | $3,150 | $392 | $203 | $189 |
| 2023 | $13,645 | $446 | $238 | $208 |
| 2022 | $13,645 | $421 | $218 | $203 |
| 2021 | $17,243 | $425 | $221 | $204 |
| 2020 | $13,456 | $632 | $483 | $149 |
| 2019 | $4,333 | $760 | $581 | $179 |
| 2018 | $4,220 | $760 | $0 | $0 |
| 2017 | $10,008 | $760 | $581 | $179 |
| 2016 | $13,919 | $760 | $581 | $179 |
| 2015 | $3,733 | $760 | $581 | $179 |
| 2014 | $3,733 | $760 | $581 | $179 |
| 2013 | $3,449 | $760 | $581 | $179 |
Source: Public Records
Map
Nearby Homes