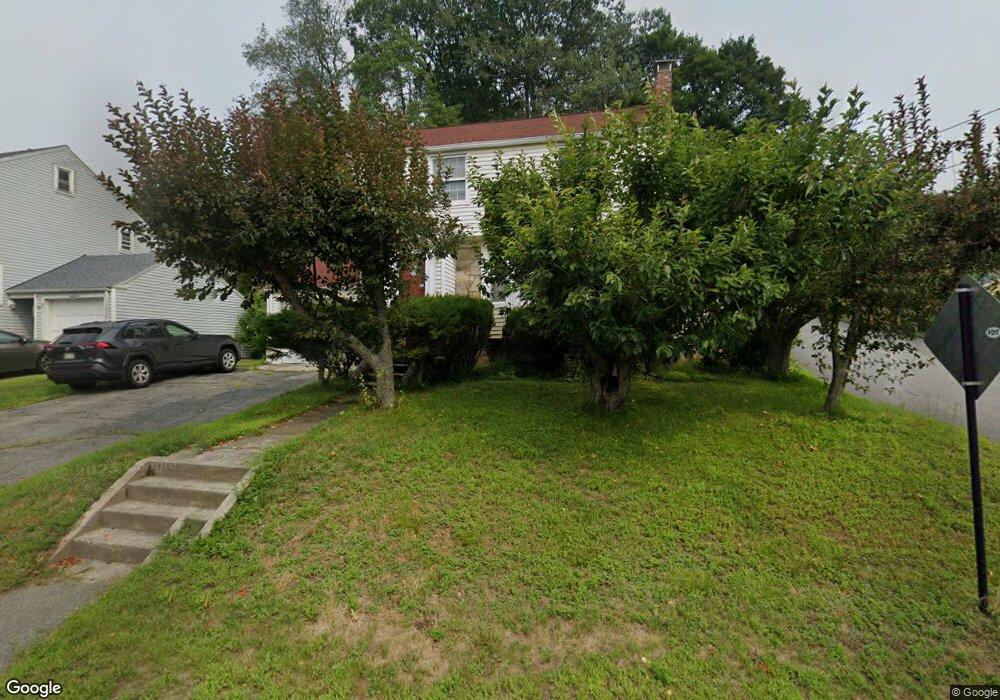
289 June St Worcester, MA 01602
Tatnuck NeighborhoodEstimated Value: $445,000 - $491,000
3
Beds
2
Baths
1,558
Sq Ft
$296/Sq Ft
Est. Value
About This Home
This home is located at 289 June St, Worcester, MA 01602 and is currently estimated at $461,511, approximately $296 per square foot. 289 June St is a home located in Worcester County with nearby schools including Chandler Magnet, Jacob Hiatt Magnet School, and May Street Elementary School.
Ownership History
Date
Name
Owned For
Owner Type
Purchase Details
Closed on
Nov 27, 2007
Sold by
Le Christopher Bao
Bought by
Le Tram-Anh
Current Estimated Value
Purchase Details
Closed on
Sep 5, 2003
Sold by
Cuong Q
Bought by
Christopher Bao
Purchase Details
Closed on
Apr 15, 1998
Sold by
Dowdell Toy and Dowdell Bettye J
Bought by
Le Cuong Q
Home Financials for this Owner
Home Financials are based on the most recent Mortgage that was taken out on this home.
Original Mortgage
$50,000
Interest Rate
7.11%
Mortgage Type
Purchase Money Mortgage
Purchase Details
Closed on
Apr 13, 1990
Sold by
Dale Tarrant T
Bought by
Dowdell Toy
Home Financials for this Owner
Home Financials are based on the most recent Mortgage that was taken out on this home.
Original Mortgage
$120,000
Interest Rate
10.13%
Mortgage Type
Purchase Money Mortgage
Create a Home Valuation Report for This Property
The Home Valuation Report is an in-depth analysis detailing your home's value as well as a comparison with similar homes in the area
Home Values in the Area
Average Home Value in this Area
Purchase History
| Date | Buyer | Sale Price | Title Company |
|---|---|---|---|
| Le Tram-Anh | -- | -- | |
| Christopher Bao | -- | -- | |
| Le Cuong Q | $96,500 | -- | |
| Dowdell Toy | $135,000 | -- |
Source: Public Records
Mortgage History
| Date | Status | Borrower | Loan Amount |
|---|---|---|---|
| Previous Owner | Dowdell Toy | $50,000 | |
| Previous Owner | Dowdell Toy | $120,000 |
Source: Public Records
Tax History
| Year | Tax Paid | Tax Assessment Tax Assessment Total Assessment is a certain percentage of the fair market value that is determined by local assessors to be the total taxable value of land and additions on the property. | Land | Improvement |
|---|---|---|---|---|
| 2025 | $5,199 | $394,200 | $114,400 | $279,800 |
| 2024 | $5,099 | $370,800 | $114,400 | $256,400 |
| 2023 | $4,894 | $341,300 | $99,500 | $241,800 |
| 2022 | $4,511 | $296,600 | $79,600 | $217,000 |
| 2021 | $4,325 | $268,700 | $63,700 | $205,000 |
| 2020 | $4,245 | $249,700 | $63,700 | $186,000 |
| 2019 | $4,086 | $227,000 | $57,300 | $169,700 |
| 2018 | $3,129 | $215,100 | $57,300 | $157,800 |
| 2017 | $3,915 | $203,700 | $57,300 | $146,400 |
| 2016 | $3,877 | $188,100 | $42,100 | $146,000 |
| 2015 | $3,775 | $188,100 | $42,100 | $146,000 |
| 2014 | $3,675 | $188,100 | $42,100 | $146,000 |
Source: Public Records
Map
Nearby Homes
- 6 Ludington Rd
- 211 June St Unit B
- 34 Rosslare Dr Unit 108
- 5 Swan Ave
- 22 Outlook Dr
- 32 Zenith Dr
- 415 Mill St
- 215 Mill St Unit 113
- 24 Geneva St
- 57 1st St
- 10 Minthorne St
- 9 Fiske St Unit A
- 34 Scandinavia Ave
- 16 Sherwood Rd
- 28 Walworth St
- 33 Carlisle St
- 47R Yarnie Unit 3A
- 47R Yarnie Unit 1B
- 47R Yarnie Unit 2B
- 47R Yarnie Unit 4B
Your Personal Tour Guide
Ask me questions while you tour the home.