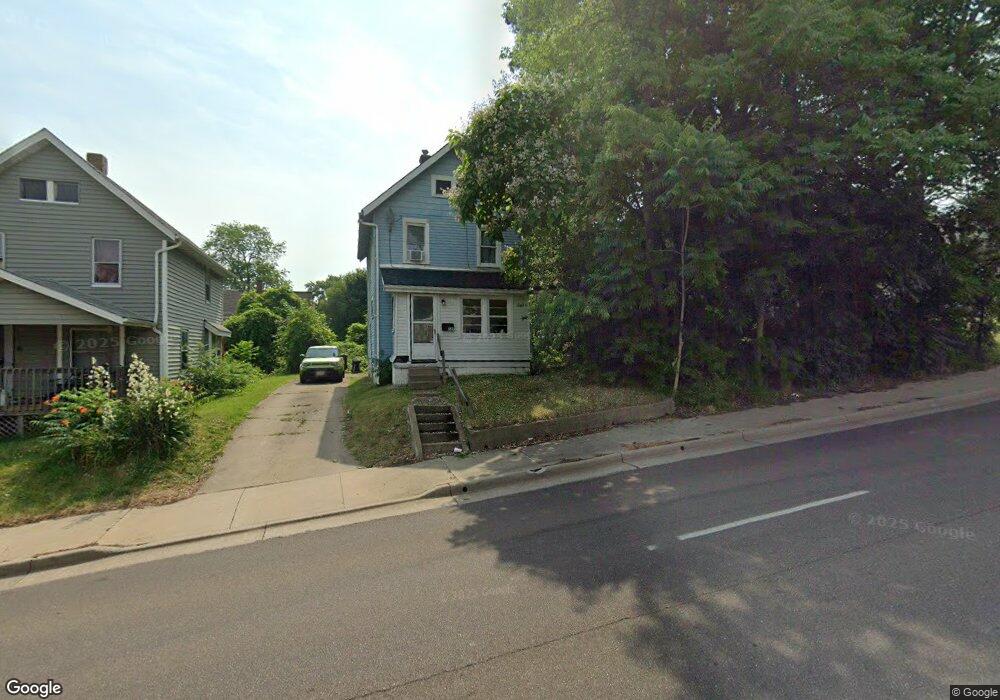
289 Kelly Ave Akron, OH 44306
East Akron NeighborhoodEstimated Value: $63,000 - $79,000
2
Beds
1
Bath
1,123
Sq Ft
$60/Sq Ft
Est. Value
About This Home
This home is located at 289 Kelly Ave, Akron, OH 44306 and is currently estimated at $67,813, approximately $60 per square foot. 289 Kelly Ave is a home located in Summit County with nearby schools including Akron Preparatory school, Case Preparatory Academy, and Middlebury Academy.
Ownership History
Date
Name
Owned For
Owner Type
Purchase Details
Closed on
May 9, 2003
Sold by
Bank One Na
Bought by
Glenn David L and Glenn Marianne S
Current Estimated Value
Purchase Details
Closed on
Oct 15, 2002
Sold by
Brenneman Kendall
Bought by
Bank One National Assn
Purchase Details
Closed on
Jul 11, 2000
Sold by
Suburban Investment Properties Inc
Bought by
Brenneman Kendall
Home Financials for this Owner
Home Financials are based on the most recent Mortgage that was taken out on this home.
Original Mortgage
$34,300
Interest Rate
13.07%
Purchase Details
Closed on
Jun 7, 2000
Sold by
Logan Estella
Bought by
Suburban Investment Properties Llc
Home Financials for this Owner
Home Financials are based on the most recent Mortgage that was taken out on this home.
Original Mortgage
$34,300
Interest Rate
13.07%
Create a Home Valuation Report for This Property
The Home Valuation Report is an in-depth analysis detailing your home's value as well as a comparison with similar homes in the area
Home Values in the Area
Average Home Value in this Area
Purchase History
| Date | Buyer | Sale Price | Title Company |
|---|---|---|---|
| Glenn David L | $14,000 | Resource Title Agency Inc | |
| Bank One National Assn | $28,000 | -- | |
| Brenneman Kendall | $49,000 | Prospect Title Agency Inc | |
| Suburban Investment Properties Llc | $15,100 | Midland Commerce Group |
Source: Public Records
Mortgage History
| Date | Status | Borrower | Loan Amount |
|---|---|---|---|
| Previous Owner | Brenneman Kendall | $34,300 | |
| Previous Owner | Suburban Investment Properties Llc | $16,300 |
Source: Public Records
Tax History Compared to Growth
Tax History
| Year | Tax Paid | Tax Assessment Tax Assessment Total Assessment is a certain percentage of the fair market value that is determined by local assessors to be the total taxable value of land and additions on the property. | Land | Improvement |
|---|---|---|---|---|
| 2025 | $837 | $10,249 | $2,251 | $7,998 |
| 2024 | $837 | $10,249 | $2,251 | $7,998 |
| 2023 | $837 | $10,249 | $2,251 | $7,998 |
| 2022 | $605 | $6,027 | $1,323 | $4,704 |
| 2021 | $605 | $6,027 | $1,323 | $4,704 |
| 2020 | $599 | $6,020 | $1,320 | $4,700 |
| 2019 | $837 | $7,370 | $3,010 | $4,360 |
| 2018 | $830 | $7,370 | $3,010 | $4,360 |
| 2017 | $796 | $7,370 | $3,010 | $4,360 |
| 2016 | $796 | $7,470 | $3,010 | $4,460 |
| 2015 | $796 | $7,470 | $3,010 | $4,460 |
| 2014 | $1,025 | $7,470 | $3,010 | $4,460 |
| 2013 | $781 | $7,490 | $3,010 | $4,480 |
Source: Public Records
Map
Nearby Homes
- 432 Fuller St
- 1216 Bittaker St
- 520 Ardella Ave
- 1129 7th Ave
- 547 van Everett Ave
- 82 Detroit St
- 697 Roscoe Ave
- 540 Anderson Ave
- 1093 Joy Ave
- 279 Miles Ave
- 426 S Arlington St
- 622 Talbot Ave
- 990 Baird St
- 553 Whitney Ave
- 0 Clara Ave
- 548 Winans Ave
- 522 Winans Ave
- 166 Chittenden St
- 975 Concord Ave
- 1095 E Archwood Ave