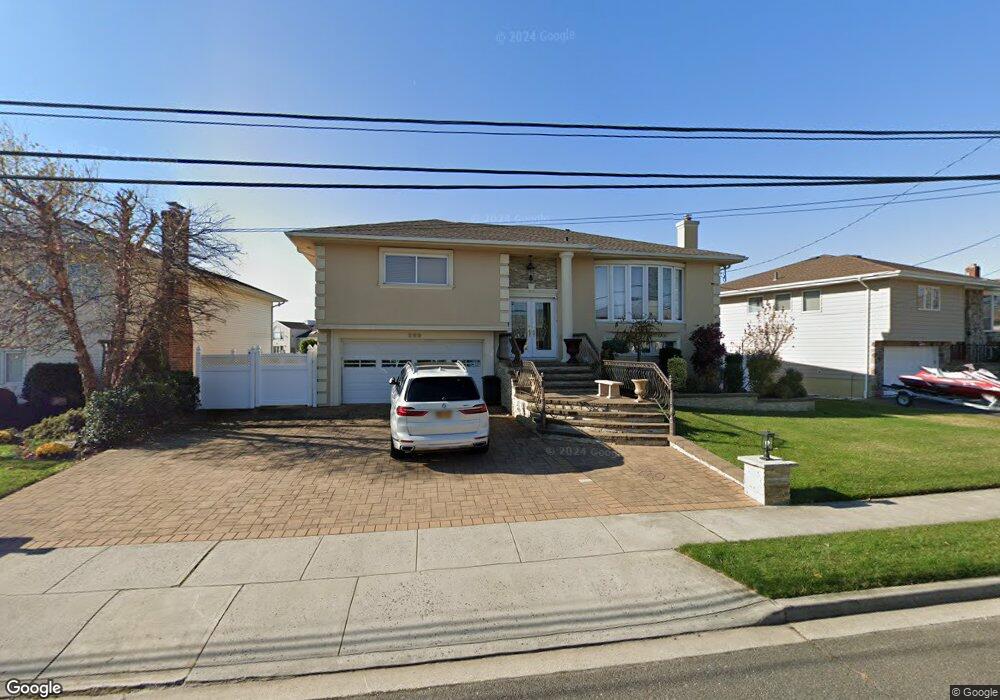
289 Links Dr W Oceanside, NY 11572
Estimated Value: $898,860 - $979,000
--
Bed
3
Baths
1,438
Sq Ft
$653/Sq Ft
Est. Value
About This Home
This home is located at 289 Links Dr W, Oceanside, NY 11572 and is currently estimated at $938,930, approximately $652 per square foot. 289 Links Dr W is a home located in Nassau County with nearby schools including Boardman Elementary School, Oceanside Middle School, and Oceanside High School.
Ownership History
Date
Name
Owned For
Owner Type
Purchase Details
Closed on
Jan 2, 1996
Sold by
Gullo Frank
Bought by
Pesce Albert
Current Estimated Value
Home Financials for this Owner
Home Financials are based on the most recent Mortgage that was taken out on this home.
Original Mortgage
$210,000
Outstanding Balance
$5,678
Interest Rate
7.31%
Estimated Equity
$933,252
Purchase Details
Closed on
Mar 2, 1995
Sold by
Campanelli Andrew Ref
Bought by
Gullo Frank
Home Financials for this Owner
Home Financials are based on the most recent Mortgage that was taken out on this home.
Original Mortgage
$175,000
Interest Rate
8.96%
Create a Home Valuation Report for This Property
The Home Valuation Report is an in-depth analysis detailing your home's value as well as a comparison with similar homes in the area
Home Values in the Area
Average Home Value in this Area
Purchase History
| Date | Buyer | Sale Price | Title Company |
|---|---|---|---|
| Pesce Albert | $300,000 | -- | |
| Gullo Frank | $157,000 | -- |
Source: Public Records
Mortgage History
| Date | Status | Borrower | Loan Amount |
|---|---|---|---|
| Open | Pesce Albert | $210,000 | |
| Previous Owner | Gullo Frank | $175,000 |
Source: Public Records
Tax History Compared to Growth
Tax History
| Year | Tax Paid | Tax Assessment Tax Assessment Total Assessment is a certain percentage of the fair market value that is determined by local assessors to be the total taxable value of land and additions on the property. | Land | Improvement |
|---|---|---|---|---|
| 2025 | $16,762 | $607 | $249 | $358 |
| 2024 | $5,244 | $631 | $259 | $372 |
| 2023 | $17,601 | $678 | $278 | $400 |
| 2022 | $17,601 | $678 | $278 | $400 |
| 2021 | $24,971 | $656 | $269 | $387 |
| 2020 | $19,561 | $1,246 | $1,201 | $45 |
| 2019 | $19,936 | $1,246 | $1,126 | $120 |
| 2018 | $18,791 | $1,329 | $0 | $0 |
| 2017 | $10,093 | $1,159 | $1,158 | $1 |
| 2016 | $15,397 | $1,159 | $932 | $227 |
| 2015 | $5,067 | $1,159 | $932 | $227 |
| 2014 | $5,067 | $1,159 | $932 | $227 |
| 2013 | $6,067 | $1,493 | $1,201 | $292 |
Source: Public Records
Map
Nearby Homes
- 341 Green Ct
- 3461 Ocean Ave
- 243 Mott St
- 237 Mott St
- 3452 Ocean Ave
- 487 Links Dr E
- 189 Philips Place
- 3391 Fairway Rd
- 3665 Carrel Blvd
- 163 Mott St
- 3515 Oceanside Rd
- 3666 Illona Ln
- 313 Jordan St
- 24 Strangford Ct
- 3309 Skillman Ave
- 3822 Greentree Dr
- 3420 Woodward St
- 3309 Balsam St
- 3305 1st St
- 3432 Bayfield Blvd