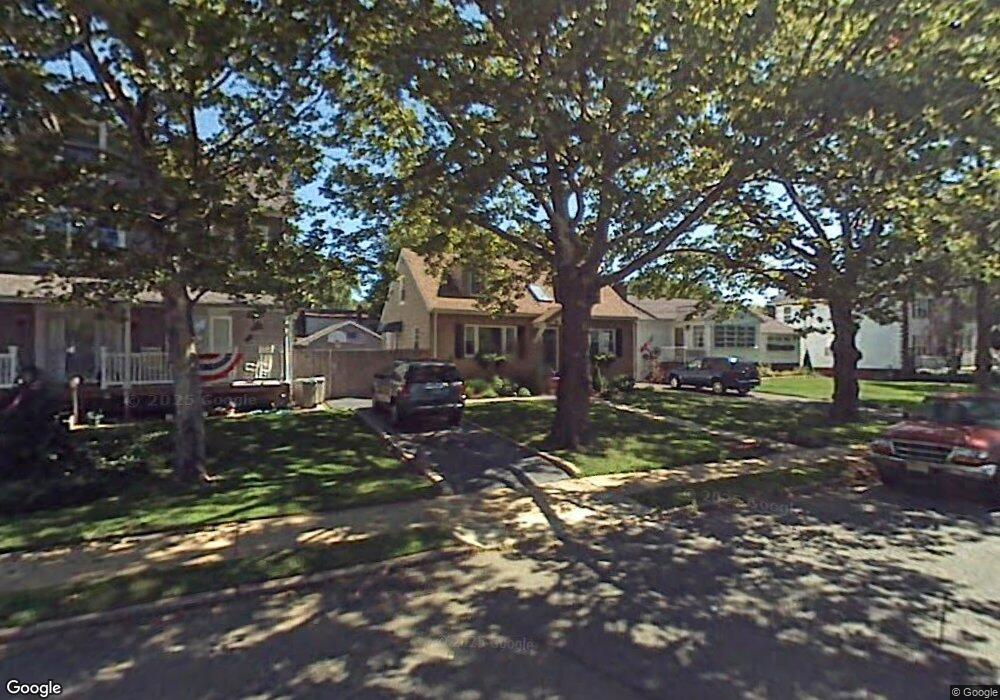
289 Main St Keyport, NJ 07735
Estimated Value: $488,603 - $644,000
3
Beds
1
Bath
1,360
Sq Ft
$393/Sq Ft
Est. Value
About This Home
This home is located at 289 Main St, Keyport, NJ 07735 and is currently estimated at $535,151, approximately $393 per square foot. 289 Main St is a home located in Monmouth County with nearby schools including Keyport Central School, Keyport High School, and Icob Academy.
Ownership History
Date
Name
Owned For
Owner Type
Purchase Details
Closed on
Sep 1, 2005
Sold by
Borg James S
Bought by
Dipaolo Michael A and Di Paolo Christy L
Current Estimated Value
Home Financials for this Owner
Home Financials are based on the most recent Mortgage that was taken out on this home.
Original Mortgage
$272,000
Outstanding Balance
$145,429
Interest Rate
5.84%
Mortgage Type
New Conventional
Estimated Equity
$389,722
Purchase Details
Closed on
Nov 26, 1997
Sold by
Martinez Rafael
Bought by
Borg James and Crerand Nicole
Home Financials for this Owner
Home Financials are based on the most recent Mortgage that was taken out on this home.
Original Mortgage
$116,000
Interest Rate
7.14%
Create a Home Valuation Report for This Property
The Home Valuation Report is an in-depth analysis detailing your home's value as well as a comparison with similar homes in the area
Home Values in the Area
Average Home Value in this Area
Purchase History
| Date | Buyer | Sale Price | Title Company |
|---|---|---|---|
| Dipaolo Michael A | $340,000 | -- | |
| Borg James | $129,000 | -- |
Source: Public Records
Mortgage History
| Date | Status | Borrower | Loan Amount |
|---|---|---|---|
| Open | Dipaolo Michael A | $272,000 | |
| Previous Owner | Borg James | $116,000 |
Source: Public Records
Tax History Compared to Growth
Tax History
| Year | Tax Paid | Tax Assessment Tax Assessment Total Assessment is a certain percentage of the fair market value that is determined by local assessors to be the total taxable value of land and additions on the property. | Land | Improvement |
|---|---|---|---|---|
| 2025 | $7,597 | $388,500 | $194,600 | $193,900 |
| 2024 | $8,260 | $367,000 | $182,700 | $184,300 |
| 2023 | $8,260 | $375,800 | $166,100 | $209,700 |
| 2022 | $6,618 | $326,700 | $144,400 | $182,300 |
| 2021 | $6,618 | $262,200 | $128,900 | $133,300 |
| 2020 | $6,378 | $250,800 | $124,000 | $126,800 |
| 2019 | $6,175 | $243,200 | $119,300 | $123,900 |
| 2018 | $5,764 | $221,700 | $105,800 | $115,900 |
| 2017 | $5,542 | $212,600 | $105,800 | $106,800 |
| 2016 | $5,390 | $208,500 | $105,800 | $102,700 |
| 2015 | $5,381 | $207,200 | $105,800 | $101,400 |
| 2014 | $5,661 | $220,100 | $96,800 | $123,300 |
Source: Public Records
Map
Nearby Homes
- 90 Saint Peters Place
- 9 Monmouth Place
- 231 Atlantic St Unit 23
- 50 State Route 36
- 195 Atlantic St
- 25-27 Brook Ave
- 69 Maple Place
- 226 Osborn St
- 47 Village Green Way
- 118 Village Green Way
- 72 Manchester Ave
- 127 Chingarora Ave
- 160 Village Green Way
- 2108 Florence Ave
- 253 Broadway
- 40 Church St
- 8 Chingarora Ave
- 95 Broadway
- 55 E Front St
- 73 2nd St