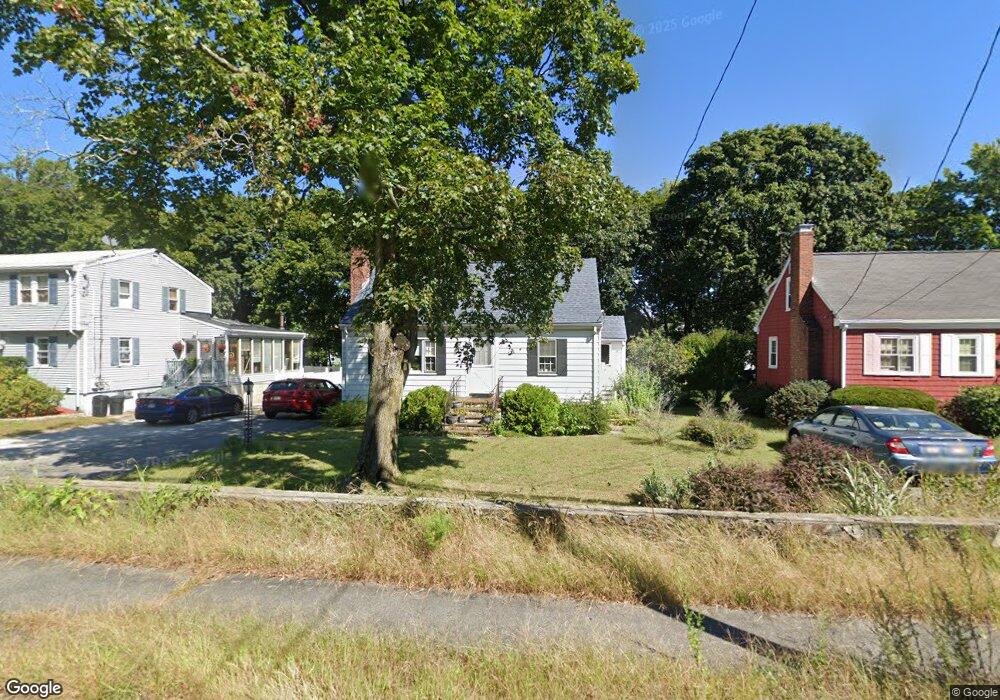
289 Main St Saugus, MA 01906
Oakland Vale NeighborhoodEstimated Value: $640,455 - $718,000
2
Beds
2
Baths
1,798
Sq Ft
$373/Sq Ft
Est. Value
About This Home
This home is located at 289 Main St, Saugus, MA 01906 and is currently estimated at $670,364, approximately $372 per square foot. 289 Main St is a home located in Essex County with nearby schools including Saugus High School, Pioneer Charter School Of Science II, and Melrose Montessori School.
Ownership History
Date
Name
Owned For
Owner Type
Purchase Details
Closed on
Jan 3, 2002
Sold by
Rosa Annmarie and Rosa Thomas G
Bought by
Ohanesian Marie A
Current Estimated Value
Home Financials for this Owner
Home Financials are based on the most recent Mortgage that was taken out on this home.
Original Mortgage
$150,000
Outstanding Balance
$58,627
Interest Rate
6.72%
Mortgage Type
Purchase Money Mortgage
Estimated Equity
$611,737
Purchase Details
Closed on
Jul 14, 1997
Sold by
Piercey Stephen A
Bought by
Rosa Thomas G
Home Financials for this Owner
Home Financials are based on the most recent Mortgage that was taken out on this home.
Original Mortgage
$156,650
Interest Rate
7.86%
Mortgage Type
Purchase Money Mortgage
Create a Home Valuation Report for This Property
The Home Valuation Report is an in-depth analysis detailing your home's value as well as a comparison with similar homes in the area
Home Values in the Area
Average Home Value in this Area
Purchase History
| Date | Buyer | Sale Price | Title Company |
|---|---|---|---|
| Ohanesian Marie A | $280,000 | -- | |
| Rosa Thomas G | $164,900 | -- |
Source: Public Records
Mortgage History
| Date | Status | Borrower | Loan Amount |
|---|---|---|---|
| Open | Ohanesian Marie A | $150,000 | |
| Previous Owner | Rosa Thomas G | $156,650 |
Source: Public Records
Tax History
| Year | Tax Paid | Tax Assessment Tax Assessment Total Assessment is a certain percentage of the fair market value that is determined by local assessors to be the total taxable value of land and additions on the property. | Land | Improvement |
|---|---|---|---|---|
| 2025 | $5,494 | $514,400 | $292,700 | $221,700 |
| 2024 | $5,151 | $483,700 | $266,100 | $217,600 |
| 2023 | $5,043 | $447,900 | $239,500 | $208,400 |
| 2022 | $4,925 | $410,100 | $219,100 | $191,000 |
| 2021 | $4,628 | $375,000 | $190,700 | $184,300 |
| 2020 | $4,364 | $366,100 | $181,800 | $184,300 |
| 2019 | $4,178 | $343,000 | $164,100 | $178,900 |
| 2018 | $3,766 | $325,200 | $159,700 | $165,500 |
| 2017 | $3,522 | $292,300 | $149,000 | $143,300 |
| 2016 | $3,229 | $264,700 | $141,800 | $122,900 |
| 2015 | $3,031 | $252,200 | $135,100 | $117,100 |
| 2014 | $2,971 | $255,900 | $135,100 | $120,800 |
Source: Public Records
Map
Nearby Homes
- 7 Blacksmith Way
- 12 Heritage Ln
- 148 Forest St
- 24 Juniper Dr
- 5 Thomas St Unit 8
- 768 Lynn Fells Pkwy
- 7 Nirvana Dr
- 12B Cheever Ave
- 12C Cheever Ave
- 57 Vine St
- 70 Ardsmoor Rd
- 34 Summer St
- 921 Sherwood Forest Ln
- 38 Cranmore Ln
- 801 Sherwood Forest Ln
- 29 Susan Dr
- 22 Susan Dr
- 24 Mount Zion Rd
- 176 Bay State Rd
- 43 Taylor St
Your Personal Tour Guide
Ask me questions while you tour the home.