289 Mcenery Rd Felton, CA 95018
Estimated Value: $809,000 - $878,339
2
Beds
2
Baths
1,108
Sq Ft
$766/Sq Ft
Est. Value
About This Home
This home is located at 289 Mcenery Rd, Felton, CA 95018 and is currently estimated at $848,335, approximately $765 per square foot. 289 Mcenery Rd is a home located in Santa Cruz County with nearby schools including San Lorenzo Valley Elementary School, San Lorenzo Valley Middle School, and San Lorenzo Valley High School.
Ownership History
Date
Name
Owned For
Owner Type
Purchase Details
Closed on
Oct 2, 2002
Sold by
Baxter William L and Estate Of Richard A Stone
Bought by
Norkoli James Eric
Current Estimated Value
Home Financials for this Owner
Home Financials are based on the most recent Mortgage that was taken out on this home.
Original Mortgage
$272,000
Outstanding Balance
$110,611
Interest Rate
5.75%
Mortgage Type
Purchase Money Mortgage
Estimated Equity
$737,724
Purchase Details
Closed on
Sep 30, 2002
Sold by
Norkoli Valerie L
Bought by
Norkoli James Eric
Home Financials for this Owner
Home Financials are based on the most recent Mortgage that was taken out on this home.
Original Mortgage
$272,000
Outstanding Balance
$110,611
Interest Rate
5.75%
Mortgage Type
Purchase Money Mortgage
Estimated Equity
$737,724
Create a Home Valuation Report for This Property
The Home Valuation Report is an in-depth analysis detailing your home's value as well as a comparison with similar homes in the area
Home Values in the Area
Average Home Value in this Area
Purchase History
| Date | Buyer | Sale Price | Title Company |
|---|---|---|---|
| Norkoli James Eric | $340,000 | Santa Cruz Title Company | |
| Norkoli James Eric | -- | Santa Cruz Title Company |
Source: Public Records
Mortgage History
| Date | Status | Borrower | Loan Amount |
|---|---|---|---|
| Open | Norkoli James Eric | $272,000 | |
| Closed | Norkoli James Eric | $68,000 |
Source: Public Records
Tax History Compared to Growth
Tax History
| Year | Tax Paid | Tax Assessment Tax Assessment Total Assessment is a certain percentage of the fair market value that is determined by local assessors to be the total taxable value of land and additions on the property. | Land | Improvement |
|---|---|---|---|---|
| 2025 | $5,990 | $492,438 | $289,670 | $202,768 |
| 2023 | $5,987 | $473,315 | $278,421 | $194,894 |
| 2022 | $5,844 | $464,035 | $272,962 | $191,073 |
| 2021 | $5,665 | $454,936 | $267,610 | $187,326 |
| 2020 | $5,451 | $450,271 | $264,866 | $185,405 |
| 2019 | $5,173 | $441,442 | $259,672 | $181,770 |
| 2018 | $5,076 | $432,787 | $254,581 | $178,206 |
| 2017 | $4,997 | $424,302 | $249,589 | $174,713 |
| 2016 | $4,941 | $415,982 | $244,695 | $171,287 |
| 2015 | $4,780 | $404,283 | $237,813 | $166,470 |
| 2014 | $3,950 | $328,685 | $193,344 | $135,341 |
Source: Public Records
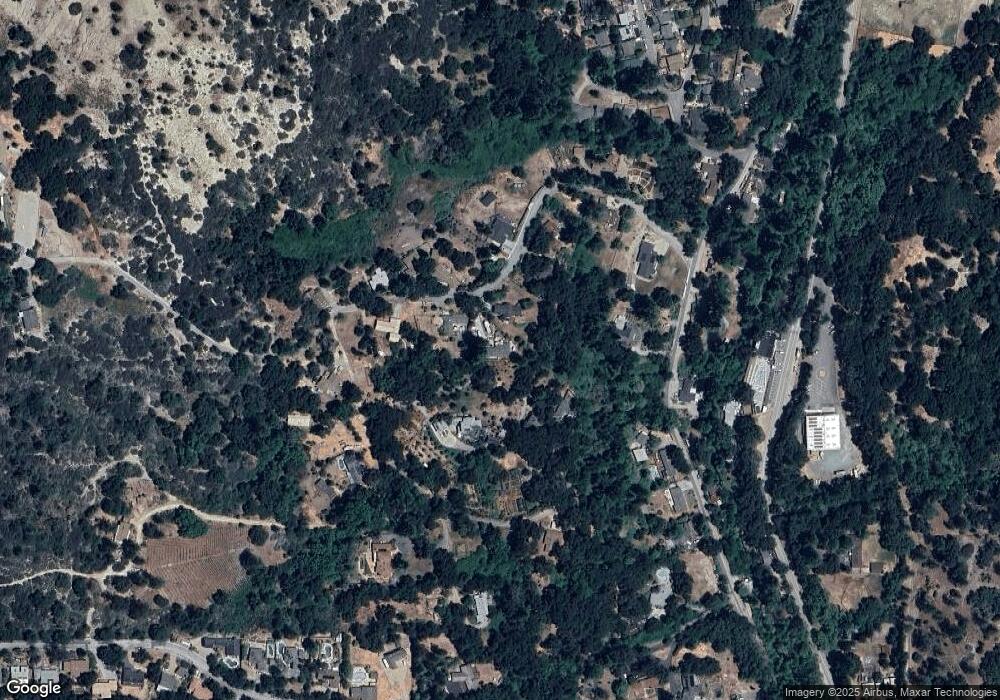
Map
Nearby Homes
- 0 Carroll Ave
- 7415 Hihn Rd
- 155 Stanford Dr
- 0 Old Mill Rd Unit OC25221127
- 000 Lompico Rd
- 620 Condor Ave
- 407 Webster Dr
- 12 Canyon Rd
- 514 Noteware Dr
- Lot 08 Lake Blvd and Lot 38 Lakeview
- 7470 Highway 9
- 185 Woodston Way
- 600 Cook Way
- 8494 Glen Arbor Rd
- Lot 08 Madrone Ave
- 40 Pine Ave
- 44 Pine Ave
- 8633 Glen Arbor Rd
- 55 Hidden Meadow Ln
- 460 River Rd
- 275 Mcenery Rd
- 295 Mcenery Rd
- 300 Mcenery Rd
- 255 Mcenery Rd
- 310 El Alamein Rd
- 335 Mcenery Rd
- 238 Mcenery Rd
- 221 Mcenery Rd
- 7805 W Zayante Rd
- 155 Mcenery Rd
- 121 Mcenery Rd
- 500 El Alamein Rd
- 220 Canyon Rd
- 156 Canyon Rd
- 230 Canyon Rd
- 330 Mcenery Rd
- 477 El Alamein Rd
- 0 Lompico Rd
- 12 E Zayante
- 329 El Alamein Rd