289 Tallapoosa Way Temple, GA 30179
Estimated Value: $500,566
3
Beds
1
Bath
1,126
Sq Ft
$445/Sq Ft
Est. Value
About This Home
This home is located at 289 Tallapoosa Way, Temple, GA 30179 and is currently estimated at $500,566, approximately $444 per square foot. 289 Tallapoosa Way is a home located in Paulding County with nearby schools including Union Elementary School, Carl Scoggins Sr. Middle School, and South Paulding High School.
Ownership History
Date
Name
Owned For
Owner Type
Purchase Details
Closed on
Sep 11, 2025
Sold by
Jones Michael L
Bought by
Jones Linda S
Current Estimated Value
Purchase Details
Closed on
Jul 19, 2011
Sold by
Ironclad Investments Llc
Bought by
Jones Michael L and Jones Linda S
Purchase Details
Closed on
Jul 9, 2004
Sold by
Walton Hansel E and Walton Sandra J
Bought by
Ironclad Investments Llc
Home Financials for this Owner
Home Financials are based on the most recent Mortgage that was taken out on this home.
Original Mortgage
$641,394
Interest Rate
6.25%
Mortgage Type
New Conventional
Purchase Details
Closed on
Jul 1, 1999
Sold by
Walton Hansel E
Bought by
Walton Hansel E
Home Financials for this Owner
Home Financials are based on the most recent Mortgage that was taken out on this home.
Original Mortgage
$17,971
Interest Rate
7.23%
Mortgage Type
New Conventional
Create a Home Valuation Report for This Property
The Home Valuation Report is an in-depth analysis detailing your home's value as well as a comparison with similar homes in the area
Home Values in the Area
Average Home Value in this Area
Purchase History
| Date | Buyer | Sale Price | Title Company |
|---|---|---|---|
| Jones Linda S | -- | -- | |
| Jones Michael L | $165,500 | -- | |
| Jones Michael L | $165,464 | -- | |
| Ironclad Investments Llc | $552,700 | -- | |
| Walton Hansel E | -- | -- |
Source: Public Records
Mortgage History
| Date | Status | Borrower | Loan Amount |
|---|---|---|---|
| Previous Owner | Ironclad Investments Llc | $641,394 | |
| Previous Owner | Walton Hansel E | $17,971 |
Source: Public Records
Tax History Compared to Growth
Tax History
| Year | Tax Paid | Tax Assessment Tax Assessment Total Assessment is a certain percentage of the fair market value that is determined by local assessors to be the total taxable value of land and additions on the property. | Land | Improvement |
|---|---|---|---|---|
| 2024 | $352 | $112,580 | $112,480 | $100 |
| 2023 | $358 | $107,088 | $107,000 | $88 |
| 2022 | $3,055 | $117,200 | $103,360 | $13,840 |
| 2021 | $687 | $83,080 | $72,320 | $10,760 |
| 2020 | $672 | $72,120 | $62,000 | $10,120 |
| 2019 | $637 | $62,720 | $53,720 | $9,000 |
| 2018 | $536 | $55,160 | $49,160 | $6,000 |
| 2017 | $515 | $54,560 | $49,160 | $5,400 |
| 2016 | $482 | $61,000 | $56,200 | $4,800 |
| 2015 | $485 | $61,120 | $56,200 | $4,920 |
| 2014 | $591 | $64,400 | $0 | $8,200 |
| 2013 | -- | $73,156 | $66,876 | $6,280 |
Source: Public Records
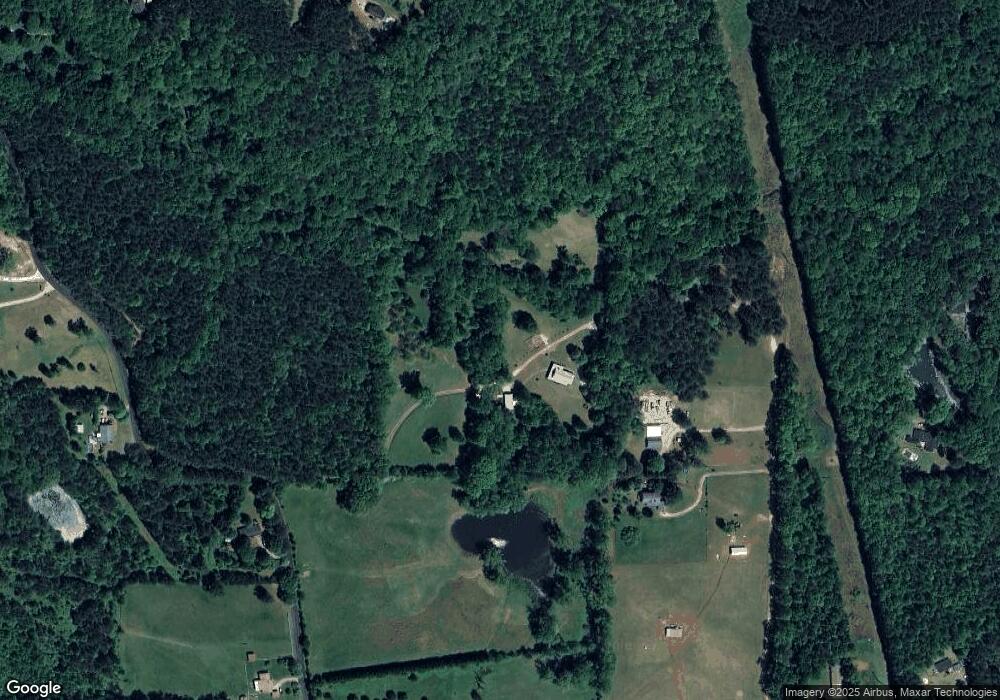
Map
Nearby Homes
- 10331 Buchanan Hwy
- 689 Hardin Rd
- 11070 Buchanan Hwy
- 836 Courthouse Park Dr Unit 13
- 959 Georgia 101
- 957 Georgia 101
- 0 Courthouse Park Dr Unit 10491475
- 221 Courthouse Park Dr
- 216 Lake Tanisha Dr
- 138 W Fork Way
- 493 Courthouse Park Dr
- 128 Tanner Dr
- 502 Courthouse Park Dr
- 391 Mulberry Rock Rd
- 162 Faithful Dr
- 207 Ivey Terrace
- 207 Ivey Terrace Unit 27
- 209 Ivey Terrace Unit 28
- 209 Ivey Terrace
- 211 Ivey Terrace
- 284 Tallapoosa Way
- 281 Tallapoosa Way
- 203 Tallapoosa Way
- 207 Tallapoosa Way
- 265 Tallapoosa Way
- 193 Tallapoosa Way
- 100 Tallapoosa Way
- 133 Tallapoosa Way
- 64 Tallapoosa Way
- 10577 Buchanan Hwy
- 10385 Buchanan Hwy
- 10391 Buchanan Hwy
- 10555 Buchanan Hwy
- 10661 Buchanan Hwy
- 695 Hardin Rd
- 10811 Buchanan Hwy
- 364 Stone Bridge Path
- 214 Stone Bridge Path Unit 5
- 10479 Buchanan Hwy
- 667 Baskin Rd