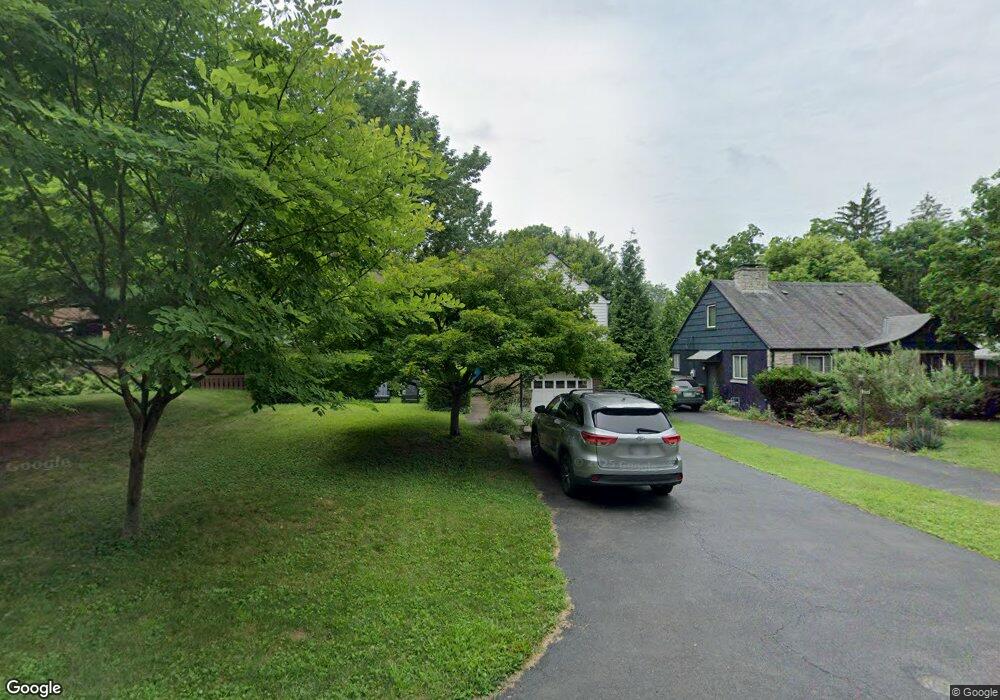
289 W Weisheimer Rd Columbus, OH 43214
Clintonville NeighborhoodEstimated Value: $417,000 - $538,000
3
Beds
1
Bath
1,737
Sq Ft
$269/Sq Ft
Est. Value
About This Home
This home is located at 289 W Weisheimer Rd, Columbus, OH 43214 and is currently estimated at $466,629, approximately $268 per square foot. 289 W Weisheimer Rd is a home located in Franklin County with nearby schools including Indian Springs Elementary School, Dominion Middle School, and Whetstone High School.
Ownership History
Date
Name
Owned For
Owner Type
Purchase Details
Closed on
May 16, 2008
Sold by
Dyer Renee K and Dyer John W
Bought by
Lehnert William E and Lehnert Stephanie K
Current Estimated Value
Home Financials for this Owner
Home Financials are based on the most recent Mortgage that was taken out on this home.
Original Mortgage
$100,000
Outstanding Balance
$63,495
Interest Rate
5.93%
Mortgage Type
Purchase Money Mortgage
Estimated Equity
$403,134
Purchase Details
Closed on
Aug 15, 2002
Sold by
Ross Ross Nancy E Nancy E and Ross Nancy
Bought by
Rana Renee K and Dyer John W
Purchase Details
Closed on
Mar 25, 1991
Bought by
Ross Nancy E
Purchase Details
Closed on
Feb 19, 1991
Purchase Details
Closed on
Dec 7, 1990
Create a Home Valuation Report for This Property
The Home Valuation Report is an in-depth analysis detailing your home's value as well as a comparison with similar homes in the area
Home Values in the Area
Average Home Value in this Area
Purchase History
| Date | Buyer | Sale Price | Title Company |
|---|---|---|---|
| Lehnert William E | $183,500 | Title First | |
| Rana Renee K | $174,900 | Title First Agency Inc | |
| Ross Nancy E | $85,500 | -- | |
| -- | -- | -- | |
| -- | -- | -- |
Source: Public Records
Mortgage History
| Date | Status | Borrower | Loan Amount |
|---|---|---|---|
| Open | Lehnert William E | $100,000 |
Source: Public Records
Tax History Compared to Growth
Tax History
| Year | Tax Paid | Tax Assessment Tax Assessment Total Assessment is a certain percentage of the fair market value that is determined by local assessors to be the total taxable value of land and additions on the property. | Land | Improvement |
|---|---|---|---|---|
| 2024 | $8,903 | $135,940 | $56,560 | $79,380 |
| 2023 | $5,604 | $126,490 | $56,560 | $69,930 |
| 2022 | $5,576 | $107,520 | $28,420 | $79,100 |
| 2021 | $5,586 | $107,520 | $28,420 | $79,100 |
| 2020 | $5,594 | $107,520 | $28,420 | $79,100 |
| 2019 | $5,092 | $83,940 | $22,720 | $61,220 |
| 2018 | $4,666 | $83,940 | $22,720 | $61,220 |
| 2017 | $4,885 | $83,940 | $22,720 | $61,220 |
| 2016 | $4,681 | $70,670 | $33,360 | $37,310 |
| 2015 | $4,250 | $70,670 | $33,360 | $37,310 |
| 2014 | $4,260 | $70,670 | $33,360 | $37,310 |
| 2013 | $1,910 | $64,225 | $30,310 | $33,915 |
Source: Public Records
Map
Nearby Homes
- 4466 Olentangy Blvd
- 4464 Zeller Rd
- 142 W Schreyer Place
- 4415 Aldrich Place
- 122 W Henderson Rd
- 111 W Henderson Rd
- 49 W Henderson Rd
- 221 Deland Ave
- 26 E Schreyer Place
- 652 Olde Towne Ave Unit 9-652E
- 652 Olde Towne Ave Unit 9-652 G
- 4 W Royal Forest Blvd
- 202 Rathbone Ave
- 116 Rathbone Ave
- 93 Leland Ave
- 156 E Weisheimer Rd
- 220 Ceramic Dr
- 19 Westwood Rd
- 255 Garden Rd
- 243 E Schreyer Place
- 295 W Weisheimer Rd
- 4597 Olentangy Blvd Unit 3071
- 4581 Olentangy Blvd
- 4600 Starrett Rd
- 4575 Olentangy Blvd
- 286 W Weisheimer Rd
- 4596 Olentangy Blvd
- 4586 Starrett Rd
- 4567 Olentangy Blvd
- 276 W Weisheimer Rd
- 4580 Olentangy Blvd
- 255 W Weisheimer Rd
- 4611 Scenic Dr
- 0 Scenic Dr
- 4559 Olentangy Blvd
- 4574 Starrett Rd
- 4566 Olentangy Blvd
- 4560 Olentangy Blvd
- 4549 Olentangy Blvd
- 239 W Weisheimer Rd