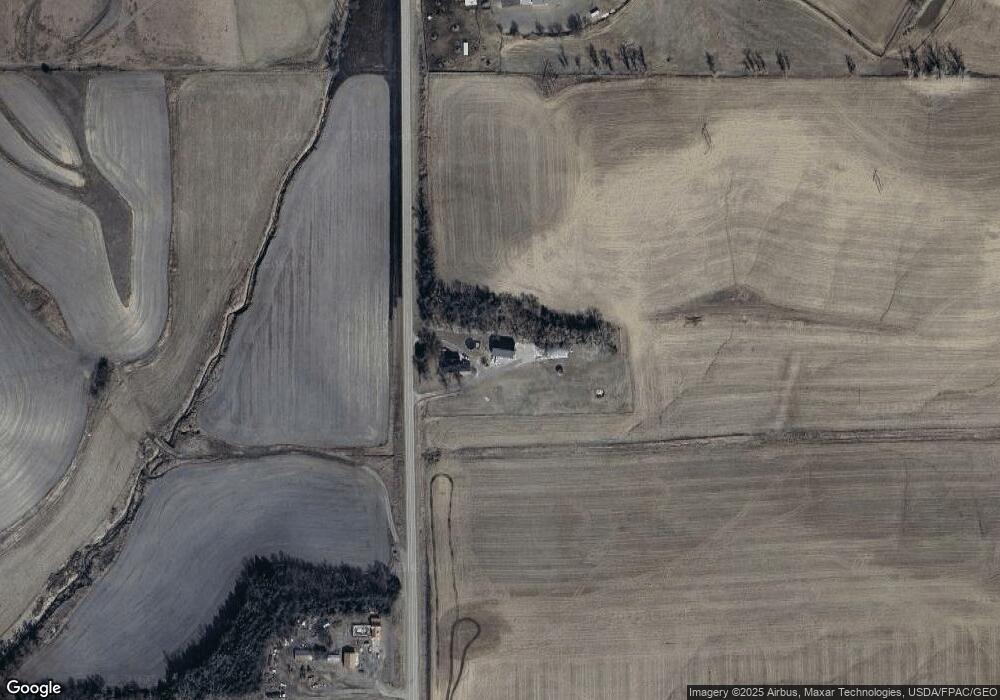
2890 Moville Blacktop Unit T Hornick, IA 51026
Estimated Value: $356,000 - $415,333
4
Beds
3
Baths
2,864
Sq Ft
$134/Sq Ft
Est. Value
About This Home
This home is located at 2890 Moville Blacktop Unit T, Hornick, IA 51026 and is currently estimated at $384,444, approximately $134 per square foot. 2890 Moville Blacktop Unit T is a home located in Woodbury County with nearby schools including Westwood Elementary School and Westwood High School.
Ownership History
Date
Name
Owned For
Owner Type
Purchase Details
Closed on
Sep 3, 2024
Sold by
Mccall Melanie L and Sanford Melanie L
Bought by
Sanford Lawrence T
Current Estimated Value
Purchase Details
Closed on
Mar 11, 2021
Sold by
Sandford Lawrence T and Sandford Melanie L
Bought by
Sandford Lawrence T and Sandford Melanie L
Purchase Details
Closed on
Feb 12, 2014
Sold by
The Estate Of Betty Lou Rich
Bought by
Sanford Lawrence
Home Financials for this Owner
Home Financials are based on the most recent Mortgage that was taken out on this home.
Original Mortgage
$87,912
Interest Rate
4.55%
Mortgage Type
Future Advance Clause Open End Mortgage
Create a Home Valuation Report for This Property
The Home Valuation Report is an in-depth analysis detailing your home's value as well as a comparison with similar homes in the area
Home Values in the Area
Average Home Value in this Area
Purchase History
| Date | Buyer | Sale Price | Title Company |
|---|---|---|---|
| Sanford Lawrence T | -- | None Listed On Document | |
| Sandford Lawrence T | -- | None Available | |
| Sanford Lawrence | $104,000 | None Available |
Source: Public Records
Mortgage History
| Date | Status | Borrower | Loan Amount |
|---|---|---|---|
| Previous Owner | Sanford Lawrence | $87,912 |
Source: Public Records
Tax History Compared to Growth
Tax History
| Year | Tax Paid | Tax Assessment Tax Assessment Total Assessment is a certain percentage of the fair market value that is determined by local assessors to be the total taxable value of land and additions on the property. | Land | Improvement |
|---|---|---|---|---|
| 2025 | $3,394 | $383,620 | $66,000 | $317,620 |
| 2024 | $3,394 | $344,680 | $44,000 | $300,680 |
| 2023 | $2,870 | $344,680 | $44,000 | $300,680 |
| 2022 | $2,836 | $250,870 | $44,000 | $206,870 |
| 2021 | $2,836 | $250,870 | $44,000 | $206,870 |
| 2020 | $2,172 | $185,960 | $47,080 | $138,880 |
| 2019 | $2,026 | $185,960 | $47,080 | $138,880 |
| 2018 | $1,952 | $166,700 | $27,820 | $138,880 |
| 2017 | $1,952 | $166,700 | $27,820 | $138,880 |
| 2016 | $1,950 | $158,520 | $0 | $0 |
| 2015 | $1,944 | $148,150 | $26,000 | $122,150 |
Source: Public Records
Map
Nearby Homes