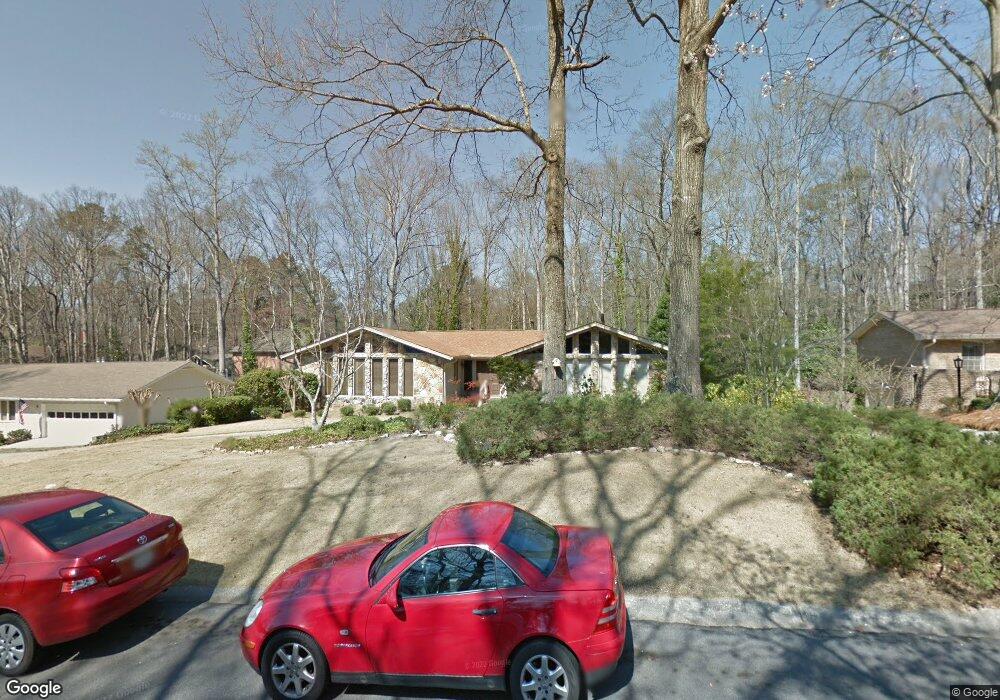
2891 Gant Quarters Dr Unit 1 Marietta, GA 30068
East Cobb NeighborhoodEstimated Value: $645,000 - $731,000
3
Beds
4
Baths
3,188
Sq Ft
$216/Sq Ft
Est. Value
About This Home
This home is located at 2891 Gant Quarters Dr Unit 1, Marietta, GA 30068 and is currently estimated at $689,535, approximately $216 per square foot. 2891 Gant Quarters Dr Unit 1 is a home located in Cobb County with nearby schools including Eastvalley Elementary School, East Cobb Middle School, and Wheeler High School.
Ownership History
Date
Name
Owned For
Owner Type
Purchase Details
Closed on
Feb 5, 2021
Sold by
Davis Anne P
Bought by
Davis William T
Current Estimated Value
Purchase Details
Closed on
May 21, 2004
Sold by
Prudential Residential Svcs
Bought by
Davis William T and Davis Anne
Purchase Details
Closed on
May 20, 2004
Sold by
Krumm Thomas M and Krumm Carol
Bought by
Prudential Residential Svcs Lp
Purchase Details
Closed on
Aug 31, 1998
Sold by
Rabin Barbara Z
Bought by
Krumm Thmas M
Home Financials for this Owner
Home Financials are based on the most recent Mortgage that was taken out on this home.
Original Mortgage
$211,500
Interest Rate
10.25%
Mortgage Type
New Conventional
Purchase Details
Closed on
Jun 7, 1995
Sold by
Papandrea Anthony R
Bought by
Rabin Barbara Z
Create a Home Valuation Report for This Property
The Home Valuation Report is an in-depth analysis detailing your home's value as well as a comparison with similar homes in the area
Home Values in the Area
Average Home Value in this Area
Purchase History
| Date | Buyer | Sale Price | Title Company |
|---|---|---|---|
| Davis William T | -- | None Available | |
| Davis William T | $306,000 | -- | |
| Prudential Residential Svcs Lp | $306,000 | -- | |
| Krumm Thmas M | $235,000 | -- | |
| Rabin Barbara Z | $220,000 | -- |
Source: Public Records
Mortgage History
| Date | Status | Borrower | Loan Amount |
|---|---|---|---|
| Previous Owner | Krumm Thmas M | $211,500 | |
| Closed | Rabin Barbara Z | $0 |
Source: Public Records
Tax History Compared to Growth
Tax History
| Year | Tax Paid | Tax Assessment Tax Assessment Total Assessment is a certain percentage of the fair market value that is determined by local assessors to be the total taxable value of land and additions on the property. | Land | Improvement |
|---|---|---|---|---|
| 2025 | $1,733 | $265,636 | $60,000 | $205,636 |
| 2024 | $1,663 | $240,340 | $60,000 | $180,340 |
| 2023 | $1,398 | $220,808 | $54,000 | $166,808 |
| 2022 | $1,538 | $198,648 | $38,000 | $160,648 |
| 2021 | $1,462 | $173,076 | $38,000 | $135,076 |
| 2020 | $1,462 | $173,076 | $38,000 | $135,076 |
| 2019 | $1,451 | $169,376 | $30,400 | $138,976 |
| 2018 | $1,451 | $169,376 | $30,400 | $138,976 |
| 2017 | $1,192 | $141,496 | $30,400 | $111,096 |
| 2016 | $1,195 | $141,496 | $30,400 | $111,096 |
| 2015 | $1,231 | $128,852 | $34,000 | $94,852 |
| 2014 | $1,254 | $128,852 | $0 | $0 |
Source: Public Records
Map
Nearby Homes
- 2790 Burtz Dr
- 2811 Georgian Terrace Unit 5
- 2851 Dale Dr
- 11 Cecil Dr
- 29 Rhodes Dr
- 15 Vickwood Ct NE
- 302 Chase Ln
- 470 Manor Oak Ln SE
- 560 Park Ln SE
- 180 Blue Sky Dr
- 61 Holt Rd NE
- 3270 Brookview Dr
- 3048 Haverford Ln SE
- 654 Grove Pkwy SE
- 3365 Turtle Lake Dr SE
- 2827 Beverly Hills Dr NE
- 3165 Brookview Dr
- 2490 Freydale Rd SE
- 3344 Brookview Dr
- 2514 Sunny Ln SE
- 2901 Gant Quarters Dr
- 2883 Gant Quarters Dr
- 2911 Gant Quarters Dr
- 129 Gant Quarters Ct
- 130 Gant Quarters Ct
- 2890 Gant Quarters Dr
- 2871 Gant Quarters Dr
- 2900 Gant Quarters Dr
- 2919 Gant Quarters Dr
- 2880 Gant Quarters Dr
- 2880 Gant Quarters Dr Unit 1
- 2910 Gant Quarters Dr
- 134 Gant Quarters Ln
- 2870 Gant Quaters Dr
- 124 Gant Quarters Ln
- 2861 Gant Quarters Dr
- 119 Gant Quarters Ct
- 2870 Gant Quarters Dr
- 2918 Gant Quarters Dr
- 2931 Gant Quarters Dr