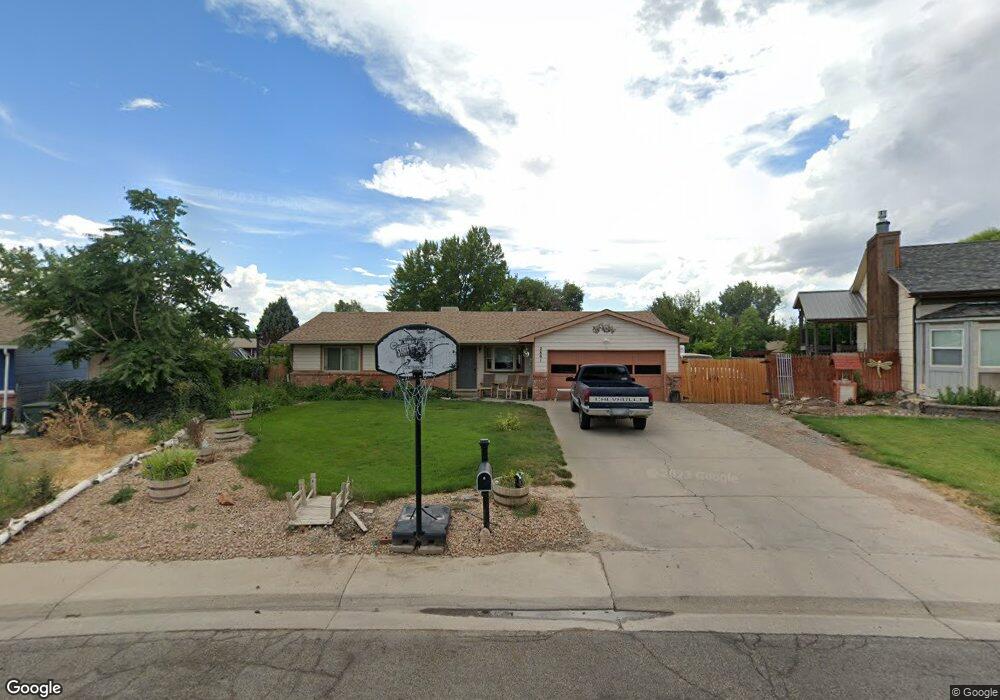
2891 Kiowa Ct Grand Junction, CO 81506
Northeast Grand Junction NeighborhoodEstimated Value: $371,021 - $439,000
3
Beds
2
Baths
1,470
Sq Ft
$278/Sq Ft
Est. Value
About This Home
This home is located at 2891 Kiowa Ct, Grand Junction, CO 81506 and is currently estimated at $408,005, approximately $277 per square foot. 2891 Kiowa Ct is a home located in Mesa County with nearby schools including Nisley Elementary School, Bookcliff Middle School, and Central High School.
Ownership History
Date
Name
Owned For
Owner Type
Purchase Details
Closed on
May 29, 2018
Sold by
Reddick Seth A and Smith Karin May
Bought by
Smith Michael N and Smith Karin May
Current Estimated Value
Home Financials for this Owner
Home Financials are based on the most recent Mortgage that was taken out on this home.
Original Mortgage
$216,404
Outstanding Balance
$187,153
Interest Rate
4.5%
Mortgage Type
VA
Estimated Equity
$220,852
Purchase Details
Closed on
Feb 26, 1997
Sold by
Lyman Weston B and Billings Constance M
Bought by
Reddick Seth A and Reddick Karin M
Home Financials for this Owner
Home Financials are based on the most recent Mortgage that was taken out on this home.
Original Mortgage
$86,400
Interest Rate
7.92%
Purchase Details
Closed on
Sep 7, 1994
Sold by
Miller Dennis G
Bought by
Reddick Seth A
Purchase Details
Closed on
Jun 25, 1992
Sold by
Dennison Daniel W
Bought by
Reddick Seth A
Create a Home Valuation Report for This Property
The Home Valuation Report is an in-depth analysis detailing your home's value as well as a comparison with similar homes in the area
Home Values in the Area
Average Home Value in this Area
Purchase History
| Date | Buyer | Sale Price | Title Company |
|---|---|---|---|
| Smith Michael N | -- | Heritage Title Co | |
| Reddick Seth A | $108,000 | -- | |
| Reddick Seth A | $108,000 | -- | |
| Reddick Seth A | $88,000 | -- |
Source: Public Records
Mortgage History
| Date | Status | Borrower | Loan Amount |
|---|---|---|---|
| Open | Smith Michael N | $216,404 | |
| Closed | Reddick Seth A | $86,400 |
Source: Public Records
Tax History Compared to Growth
Tax History
| Year | Tax Paid | Tax Assessment Tax Assessment Total Assessment is a certain percentage of the fair market value that is determined by local assessors to be the total taxable value of land and additions on the property. | Land | Improvement |
|---|---|---|---|---|
| 2024 | $1,490 | $20,500 | $4,830 | $15,670 |
| 2023 | $1,490 | $20,500 | $4,830 | $15,670 |
| 2022 | $1,257 | $16,850 | $4,170 | $12,680 |
| 2021 | $1,262 | $17,330 | $4,290 | $13,040 |
| 2020 | $1,179 | $16,520 | $3,580 | $12,940 |
| 2019 | $1,119 | $16,520 | $3,580 | $12,940 |
| 2018 | $1,078 | $14,460 | $3,240 | $11,220 |
| 2017 | $1,051 | $14,460 | $3,240 | $11,220 |
| 2016 | $902 | $13,840 | $3,180 | $10,660 |
| 2015 | $915 | $13,840 | $3,180 | $10,660 |
| 2014 | $768 | $11,570 | $2,790 | $8,780 |
Source: Public Records
Map
Nearby Homes
- 2876 Patterson Rd
- 596 Sinatra Way
- 630 Sparn Ct
- 595 Teatro Ct
- 581 W Indian Creek Dr Unit 2,4,5,6
- 571 Graff Meadows Dr
- 2923 Bonito Ave
- 569 Graff Dairy Ct
- 575 29 Rd
- 2866 Presley Ave
- 2982 Patterson Rd
- 567 Cagney Ct
- 2928 Amethyst Ct
- 585 29 3 8 Rd
- 557 N Sparn Ct
- 2836 Grand Falls Cir Unit A
- 639 Mount Julian Dr
- 2919 Brodick Way
- 585 29 1 2 Rd
- 575 28 1 2 Rd Unit 66
- 0 Kiowa Ct
- 2889 Kiowa Ct
- 2889 1/2 Kiowa Ct
- 2893 Kiowa Ct
- 604 Arapahoe Way
- 603 E Indian Creek Dr
- 606 Arapahoe Way
- 0 Arapahoe Way Unit 607202
- 0 Arapahoe Way Unit 622990
- 0 Arapahoe Way Unit 630908
- 0 Arapahoe Way Unit 646848
- 0 Arapahoe Way Unit 655318
- 608 1/2 Arapahoe Way
- 2890 Kiowa Ct
- 2892 Kiowa Ct
- 608 Arapahoe Way
- 610 Arapahoe Way
- 2754 Indian Wash Cir Unit 14
- 2887 Kiowa Ct
- 2721 Indian Wash Cir Unit 1