
Landlord's Agent in 2018
Katelyn Day
Real Broker, LLC
(832) 317-6006
588 Total Sales
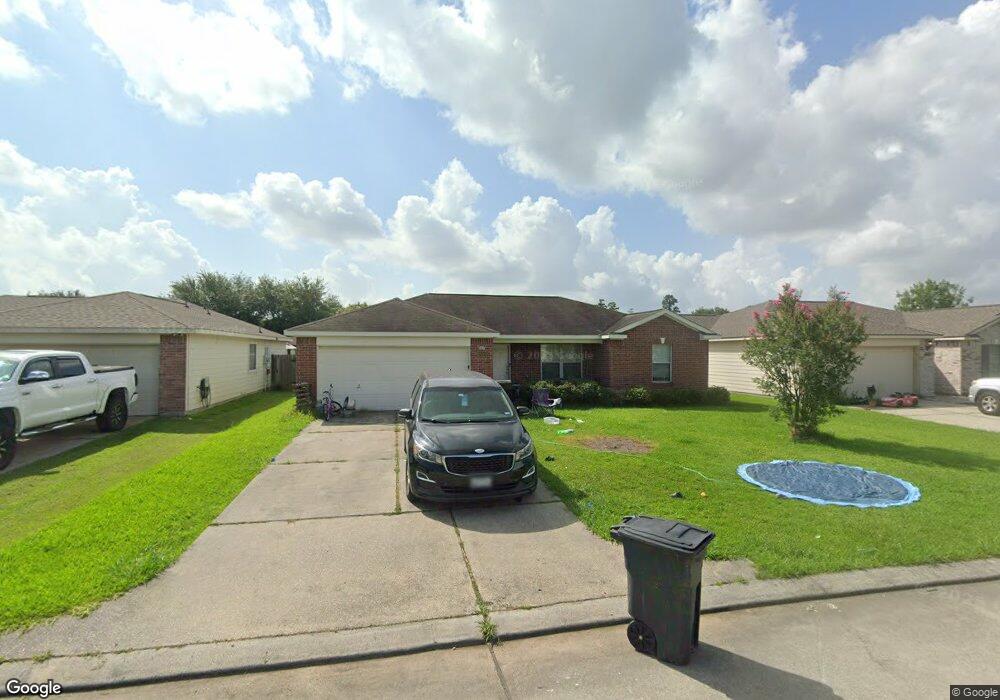

Estimated Value: $204,427 - $237,000
The search is over! Your dream home awaits. Features include an open floor plan, stylish lighting fixtures, and hardwood and tile floors. The beautiful kitchen has updated appliances and lovely white cabinets. You’ll love the large and relaxing rooms. This home won’t last long!
| Date | Buyer | Sale Price | Title Company |
|---|---|---|---|
| Srp Sub Llc | -- | -- | |
| Tarbert Llc | -- | Alamo Title Co | |
| Niblack Anthony | -- | None Available | |
| Magruder Travis | -- | American Title Co |
| Date | Status | Borrower | Loan Amount |
|---|---|---|---|
| Previous Owner | Niblack Anthony | $69,999 | |
| Previous Owner | Magruder Travis | $114,070 |
| Date | Event | Price | List to Sale | Price per Sq Ft |
|---|---|---|---|---|
| 12/30/2021 12/30/21 | Off Market | $1,250 | -- | -- |
| 01/31/2018 01/31/18 | Rented | $1,250 | 0.0% | -- |
| 01/12/2018 01/12/18 | For Rent | $1,250 | 0.0% | -- |
| 01/12/2018 01/12/18 | Rented | $1,250 | -0.7% | -- |
| 11/14/2014 11/14/14 | Rented | $1,259 | 0.0% | -- |
| 10/15/2014 10/15/14 | Under Contract | -- | -- | -- |
| 10/07/2014 10/07/14 | For Rent | $1,259 | -- | -- |
| Year | Tax Paid | Tax Assessment Tax Assessment Total Assessment is a certain percentage of the fair market value that is determined by local assessors to be the total taxable value of land and additions on the property. | Land | Improvement |
|---|---|---|---|---|
| 2025 | $3,449 | $219,104 | $35,349 | $183,755 |
| 2024 | $3,407 | $218,376 | $35,349 | $183,027 |
| 2023 | $3,407 | $216,210 | $35,350 | $180,860 |
| 2022 | $3,357 | $193,450 | $35,350 | $158,100 |
| 2021 | $2,904 | $157,060 | $35,350 | $121,710 |
| 2020 | $2,819 | $145,000 | $35,350 | $109,650 |
| 2019 | $2,819 | $139,930 | $35,350 | $104,580 |
| 2018 | $2,668 | $132,470 | $35,350 | $97,120 |
| 2017 | $2,706 | $134,540 | $35,350 | $99,190 |
| 2016 | $2,510 | $124,780 | $35,350 | $89,430 |
| 2015 | $2,073 | $120,000 | $35,350 | $84,650 |
| 2014 | $2,073 | $102,010 | $35,350 | $66,660 |
Landlord's Agent in 2018
Katelyn Day
Real Broker, LLC
(832) 317-6006
588 Total Sales
Landlord's Co-Listing Agent in 2018
Ryan Steer
Real Broker, LLC
(832) 271-5775
132 Total Sales
M
Seller's Agent in 2014
Melissa Wells
Intero The Woodlands Office
N
Buyer's Agent in 2014
Nonmls
Houston Association of REALTORS
Source: Houston Association of REALTORS®
MLS Number: 54255579
APN: 3527-00-14400
Disclaimer: Certain information contained herein is derived from information provided by parties other than Homes.com. All information provided is deemed reliable, but is not guaranteed to be accurate and should be independently verified.
![]() Copyright 2026, Houston REALTORS® Information Service, Inc.
Copyright 2026, Houston REALTORS® Information Service, Inc.
The information provided is exclusively for consumers’ personal, non-commercial use, and may not be used for any purpose other than to identify prospective properties consumers may be interested in purchasing.
Information is deemed reliable but not guaranteed.
Ask me questions while you tour the home.