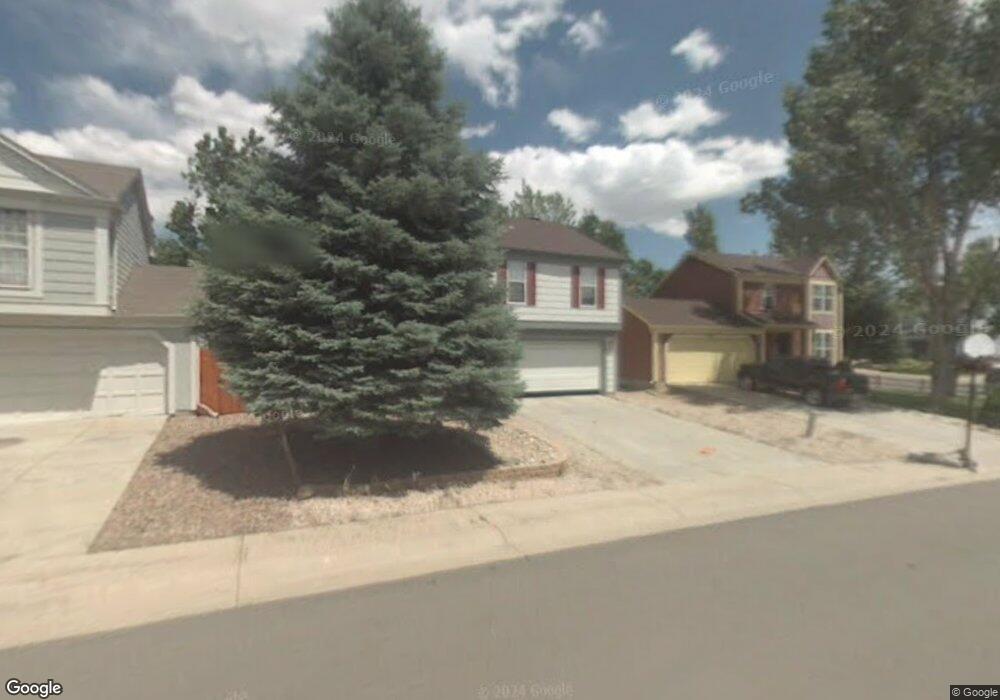
2892 S Genoa St Aurora, CO 80013
Seven Hills NeighborhoodEstimated Value: $436,301 - $445,000
3
Beds
2
Baths
1,300
Sq Ft
$339/Sq Ft
Est. Value
About This Home
This home is located at 2892 S Genoa St, Aurora, CO 80013 and is currently estimated at $440,075, approximately $338 per square foot. 2892 S Genoa St is a home located in Arapahoe County with nearby schools including Arrowhead Elementary School, Horizon Middle School, and Smoky Hill High School.
Ownership History
Date
Name
Owned For
Owner Type
Purchase Details
Closed on
Feb 4, 2000
Sold by
Gibbens Ronald R and Gibbens Ann C
Bought by
Hurd Susan A and Hurd Frederick P
Current Estimated Value
Home Financials for this Owner
Home Financials are based on the most recent Mortgage that was taken out on this home.
Original Mortgage
$100,000
Outstanding Balance
$33,057
Interest Rate
8.16%
Estimated Equity
$407,018
Purchase Details
Closed on
Sep 30, 1993
Sold by
Hinsvark Brian A and Hinsvark Lorelei
Bought by
Gibbens Ronald R and Gibbens Ann C
Home Financials for this Owner
Home Financials are based on the most recent Mortgage that was taken out on this home.
Original Mortgage
$90,100
Interest Rate
7.11%
Purchase Details
Closed on
Jun 26, 1992
Sold by
Conversion Arapco
Bought by
Hinsvark Brian A Hinsvark Lorelei
Purchase Details
Closed on
Mar 1, 1985
Sold by
Conversion Arapco
Bought by
Conversion Arapco
Purchase Details
Closed on
Apr 1, 1984
Bought by
Conversion Arapco
Create a Home Valuation Report for This Property
The Home Valuation Report is an in-depth analysis detailing your home's value as well as a comparison with similar homes in the area
Home Values in the Area
Average Home Value in this Area
Purchase History
| Date | Buyer | Sale Price | Title Company |
|---|---|---|---|
| Hurd Susan A | $153,000 | -- | |
| Gibbens Ronald R | $94,800 | -- | |
| Hinsvark Brian A Hinsvark Lorelei | -- | -- | |
| Conversion Arapco | -- | -- | |
| Conversion Arapco | -- | -- |
Source: Public Records
Mortgage History
| Date | Status | Borrower | Loan Amount |
|---|---|---|---|
| Open | Hurd Susan A | $100,000 | |
| Previous Owner | Gibbens Ronald R | $90,100 |
Source: Public Records
Tax History Compared to Growth
Tax History
| Year | Tax Paid | Tax Assessment Tax Assessment Total Assessment is a certain percentage of the fair market value that is determined by local assessors to be the total taxable value of land and additions on the property. | Land | Improvement |
|---|---|---|---|---|
| 2024 | $1,980 | $28,616 | -- | -- |
| 2023 | $1,980 | $28,616 | $0 | $0 |
| 2022 | $1,713 | $23,651 | $0 | $0 |
| 2021 | $1,724 | $23,651 | $0 | $0 |
| 2020 | $1,642 | $22,859 | $0 | $0 |
| 2019 | $1,584 | $22,859 | $0 | $0 |
| 2018 | $1,366 | $18,526 | $0 | $0 |
| 2017 | $1,346 | $18,526 | $0 | $0 |
| 2016 | $1,257 | $16,215 | $0 | $0 |
| 2015 | $1,196 | $16,215 | $0 | $0 |
| 2014 | $951 | $11,423 | $0 | $0 |
| 2013 | -- | $11,570 | $0 | $0 |
Source: Public Records
Map
Nearby Homes
- 19525 E Bates Ave
- 19930 E Cornell Ave
- 2873 S Espana St
- 19543 E Amherst Dr
- 3051 S Espana Way
- 19801 E Dartmouth Ave
- 2844 S Jebel Way
- 19193 E Amherst Dr
- 19303 E College Dr Unit 207
- 3160 S Halifax St
- 2599 S Jebel Way
- 20394 E Colgate Place
- 19871 E Lasalle Dr
- 2758 S Cathay Ct
- 2705 S Danube Way Unit 307
- 20148 E Dartmouth Dr
- 19398 E Eastman Place
- 2786 S Cathay Way
- 2544 S Fundy Cir
- 18897 E Linvale Place
- 2884 S Genoa St
- 2894 S Genoa St
- 19827 E Brunswick Dr
- 2882 S Genoa St
- 19817 E Brunswick Dr
- 19807 E Brunswick Dr
- 19837 E Brunswick Dr
- 2891 S Genoa St
- 2874 S Genoa St
- 2893 S Genoa St
- 2883 S Genoa St
- 19839 E Brunswick Dr
- 2881 S Genoa St
- 19802 E Bates Ave
- 2864 S Genoa St
- 19790 E Bates Ave
- 19892 E Bates Ave
- 19760 E Bates Ave
- 19828 E Brunswick Dr
- 2873 S Genoa St