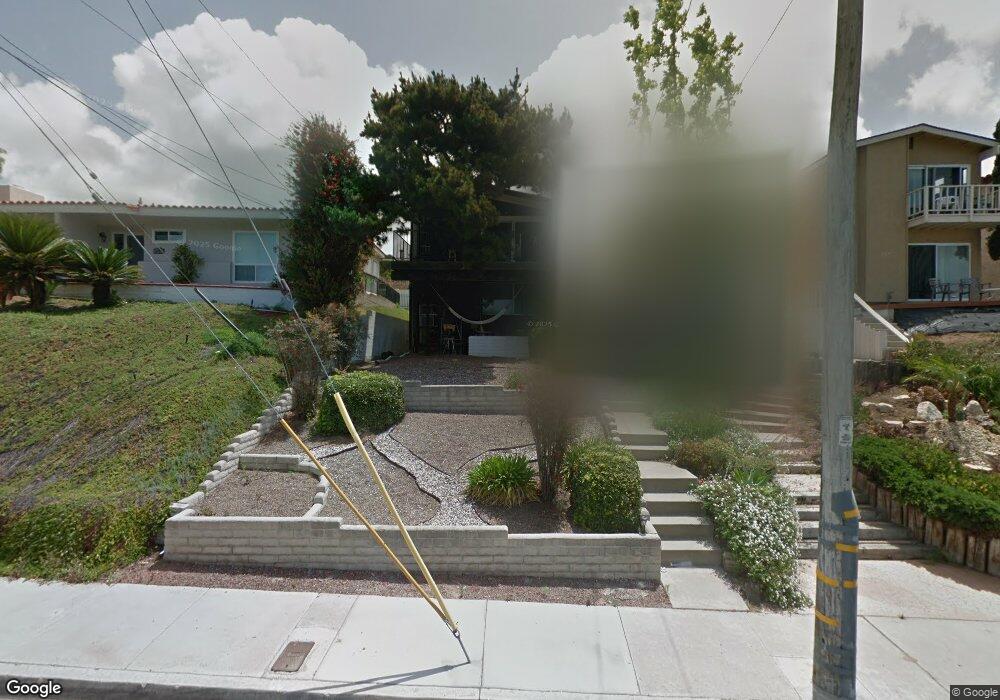
2893 Mcgraw St San Diego, CA 92117
Bay Park NeighborhoodEstimated Value: $1,197,633 - $1,465,000
2
Beds
2
Baths
1,403
Sq Ft
$976/Sq Ft
Est. Value
About This Home
This home is located at 2893 Mcgraw St, San Diego, CA 92117 and is currently estimated at $1,369,658, approximately $976 per square foot. 2893 Mcgraw St is a home located in San Diego County with nearby schools including Toler Elementary School, Marston Middle School, and Clairemont High School.
Ownership History
Date
Name
Owned For
Owner Type
Purchase Details
Closed on
May 13, 2019
Sold by
William R Zillich Trust
Bought by
Upchurch Matthew R and Beerbaum Stasia L
Current Estimated Value
Home Financials for this Owner
Home Financials are based on the most recent Mortgage that was taken out on this home.
Original Mortgage
$757,000
Outstanding Balance
$662,839
Interest Rate
4%
Mortgage Type
VA
Estimated Equity
$706,819
Purchase Details
Closed on
Dec 14, 2007
Sold by
Bay Front Terrace Lp
Bought by
Zillich William R
Purchase Details
Closed on
Sep 15, 2005
Sold by
Zillich William R
Bought by
Bay Front Terrace Lp
Purchase Details
Closed on
Aug 7, 1998
Sold by
Robin Leo B Trust and Kenneth D
Bought by
Zillich William R
Home Financials for this Owner
Home Financials are based on the most recent Mortgage that was taken out on this home.
Original Mortgage
$157,500
Interest Rate
6.6%
Create a Home Valuation Report for This Property
The Home Valuation Report is an in-depth analysis detailing your home's value as well as a comparison with similar homes in the area
Home Values in the Area
Average Home Value in this Area
Purchase History
| Date | Buyer | Sale Price | Title Company |
|---|---|---|---|
| Upchurch Matthew R | $855,000 | First American Ttl San Diego | |
| Zillich William R | -- | None Available | |
| Bay Front Terrace Lp | -- | -- | |
| Zillich William R | $225,000 | First American Title |
Source: Public Records
Mortgage History
| Date | Status | Borrower | Loan Amount |
|---|---|---|---|
| Open | Upchurch Matthew R | $757,000 | |
| Previous Owner | Zillich William R | $157,500 |
Source: Public Records
Tax History Compared to Growth
Tax History
| Year | Tax Paid | Tax Assessment Tax Assessment Total Assessment is a certain percentage of the fair market value that is determined by local assessors to be the total taxable value of land and additions on the property. | Land | Improvement |
|---|---|---|---|---|
| 2025 | $11,518 | $953,764 | $752,972 | $200,792 |
| 2024 | $11,518 | $935,063 | $738,208 | $196,855 |
| 2023 | $11,264 | $916,730 | $723,734 | $192,996 |
| 2022 | $10,965 | $898,756 | $709,544 | $189,212 |
| 2021 | $10,890 | $881,134 | $695,632 | $185,502 |
| 2020 | $10,758 | $872,100 | $688,500 | $183,600 |
| 2019 | $3,842 | $316,190 | $210,797 | $105,393 |
| 2018 | $3,591 | $309,991 | $206,664 | $103,327 |
| 2017 | $3,504 | $303,913 | $202,612 | $101,301 |
| 2016 | $3,446 | $297,955 | $198,640 | $99,315 |
| 2015 | $3,477 | $293,481 | $195,657 | $97,824 |
| 2014 | $3,423 | $287,733 | $191,825 | $95,908 |
Source: Public Records
Map
Nearby Homes
- 2841 Lloyd St
- 2514 Clairemont Dr Unit 306
- 2510 Clairemont Dr Unit 303
- 2540 Clairemont Dr Unit 202
- 2530 Clairemont Dr Unit 107
- 2540 Clairemont Dr Unit 307
- 2727 Morena Blvd Unit 309
- 2916 Chicago St
- 2910 Erie St
- 2949 Erie St
- 2630 Erie St Unit 16
- 3212 Donley St
- 3154 Lloyd St
- 3226 Lloyd St
- 2812 Hartford Ct
- 4603 Huron Ave
- 4436 Lister St
- 4850 Field St
- 4770 Jellett St
- 4356 Milton St
- 2885 Mcgraw St
- 2905 Mcgraw St
- 2877 Mcgraw St
- 2871 Morena Blvd
- 2865 Morena Blvd
- 2915 Mcgraw St
- 2827 Morena Blvd Unit 31
- 2870 Lloyd St
- 2844 Lloyd St
- 2880 Lloyd St
- 2836 Lloyd St
- 2890 Lloyd St
- 2920 Mcgraw St
- 2925 Mcgraw St
- 2821 Morena Blvd
- 2910 Lloyd St
- 2828 Lloyd St
- 2926 Lloyd St
- 2822 Lloyd St
- 2935 Mcgraw St