Estimated Value: $399,242 - $453,000
4
Beds
4
Baths
2,650
Sq Ft
$165/Sq Ft
Est. Value
About This Home
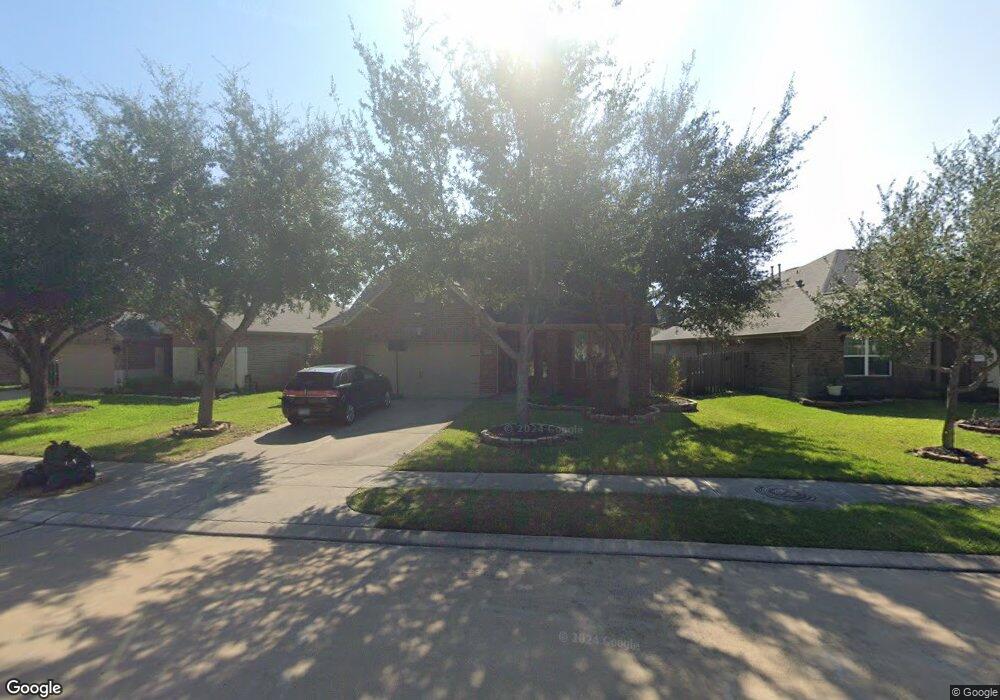
This home is located at 28935 Davenport Dr, Katy, TX 77494 and is currently estimated at $436,811, approximately $164 per square foot. 28935 Davenport Dr is a home located in Fort Bend County with nearby schools including Kathleen Joerger Lindsey Elementary School, Dean Leaman Junior High School, and Fulshear High School.
Ownership History
Date
Name
Owned For
Owner Type
Purchase Details
Closed on
Jun 26, 2015
Sold by
Arriola Carlos and Arriola Beth
Bought by
Garza Michelle and Garza Enrique
Current Estimated Value
Home Financials for this Owner
Home Financials are based on the most recent Mortgage that was taken out on this home.
Original Mortgage
$280,250
Outstanding Balance
$218,904
Interest Rate
3.91%
Mortgage Type
New Conventional
Estimated Equity
$217,907
Purchase Details
Closed on
Mar 30, 2012
Sold by
Perry Homes Llc
Bought by
Arriola Carlos
Home Financials for this Owner
Home Financials are based on the most recent Mortgage that was taken out on this home.
Original Mortgage
$224,627
Interest Rate
3.97%
Mortgage Type
VA
Purchase Details
Closed on
Oct 28, 2011
Sold by
Jdc Firethorne Ltd
Bought by
Perry Homes Llc
Create a Home Valuation Report for This Property
The Home Valuation Report is an in-depth analysis detailing your home's value as well as a comparison with similar homes in the area
Home Values in the Area
Average Home Value in this Area
Purchase History
| Date | Buyer | Sale Price | Title Company |
|---|---|---|---|
| Garza Michelle | -- | Stewart Title | |
| Arriola Carlos | -- | Chicago Title | |
| Garza Michelle | -- | -- | |
| Perry Homes Llc | -- | Chicago Title | |
| Garza Michelle | -- | -- |
Source: Public Records
Mortgage History
| Date | Status | Borrower | Loan Amount |
|---|---|---|---|
| Open | Garza Michelle | $280,250 | |
| Previous Owner | Garza Michelle | $224,627 |
Source: Public Records
Tax History Compared to Growth
Tax History
| Year | Tax Paid | Tax Assessment Tax Assessment Total Assessment is a certain percentage of the fair market value that is determined by local assessors to be the total taxable value of land and additions on the property. | Land | Improvement |
|---|---|---|---|---|
| 2025 | $7,508 | $415,501 | $63,063 | $352,438 |
| 2024 | $7,508 | $382,179 | $46,543 | $335,636 |
| 2023 | $6,912 | $347,435 | $0 | $364,796 |
| 2022 | $7,251 | $315,850 | $0 | $324,570 |
| 2021 | $7,422 | $287,140 | $44,100 | $243,040 |
| 2020 | $7,319 | $280,170 | $44,100 | $236,070 |
| 2019 | $7,602 | $271,110 | $42,000 | $229,110 |
| 2018 | $7,662 | $270,820 | $42,000 | $228,820 |
| 2017 | $7,862 | $274,510 | $42,000 | $232,510 |
| 2016 | $8,104 | $282,960 | $42,000 | $240,960 |
| 2015 | $3,957 | $241,990 | $42,000 | $199,990 |
| 2014 | $3,720 | $219,990 | $42,000 | $177,990 |
Source: Public Records
Map
Nearby Homes
- 29018 Pinnacle Ridge Dr
- 2818 Mcdonough Way
- 2718 Misty Laurel Ct
- 29011 Erica Lee Ct
- 28915 Davenport Dr
- 29046 Davenport Dr
- 2843 Mcdonough Way
- 29011 Oldfield Ct
- 28918 Hollycrest Dr
- 29110 Davenport Dr
- 28814 Davenport Dr
- 29114 Davenport Dr
- 28919 Crested Butte Dr
- 29003 Jacobs River Dr
- 2851 Park Hills Dr
- 29014 Jacobs River Dr
- 2907 Isla Gorge Ct
- 29226 Erica Lee Ct
- 28622 Blue Holly Ln
- 29323 Crested Butte Dr
- 29003 Davenport Dr
- 28931 Davenport Dr
- 29007 Davenport Dr
- 2810 Mcdonough Way
- 28927 Davenport Dr
- 2723 Misty Laurel Ct
- 29011 Davenport Dr
- 2814 Mcdonough Way
- 2722 Misty Laurel Ct
- 2719 Misty Laurel Ct
- 29015 Davenport Dr
- 2714 Mcdonough Way
- 29010 Pinnacle Ridge Dr
- 29014 Pinnacle Ridge Dr
- 2715 Misty Laurel Ct
- 29019 Davenport Dr
- 29014 Davenport Dr
- 2714 Misty Laurel Ct
- 2710 Mcdonough Way
- 28919 Davenport Dr