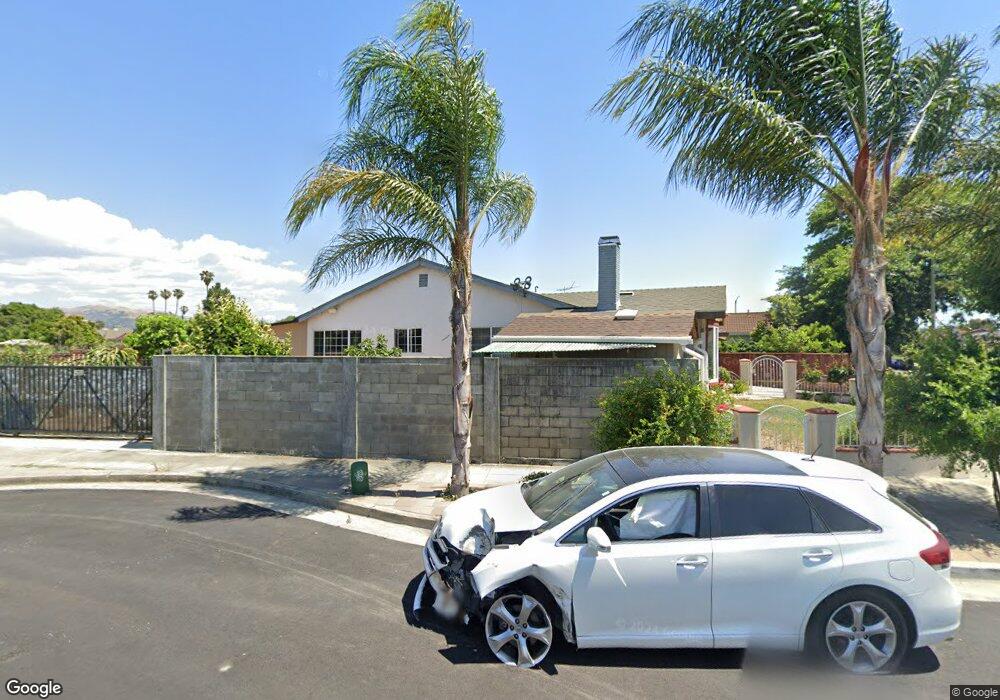
2894 Via Encinitas San Jose, CA 95132
Capewood NeighborhoodEstimated Value: $1,660,000 - $1,773,000
4
Beds
2
Baths
1,918
Sq Ft
$900/Sq Ft
Est. Value
About This Home
This home is located at 2894 Via Encinitas, San Jose, CA 95132 and is currently estimated at $1,727,122, approximately $900 per square foot. 2894 Via Encinitas is a home located in Santa Clara County with nearby schools including Laneview Elementary School, Morrill Middle School, and Independence High School.
Ownership History
Date
Name
Owned For
Owner Type
Purchase Details
Closed on
Sep 19, 2011
Sold by
Truong Songthi and Truong Song Thi
Bought by
Tran Thang H and Truong Songthi
Current Estimated Value
Home Financials for this Owner
Home Financials are based on the most recent Mortgage that was taken out on this home.
Original Mortgage
$329,000
Outstanding Balance
$28,866
Interest Rate
4.16%
Mortgage Type
New Conventional
Estimated Equity
$1,698,256
Purchase Details
Closed on
Jun 26, 2009
Sold by
Fdic
Bought by
Truong Song Thi
Home Financials for this Owner
Home Financials are based on the most recent Mortgage that was taken out on this home.
Original Mortgage
$352,500
Interest Rate
4.87%
Mortgage Type
Purchase Money Mortgage
Purchase Details
Closed on
Mar 4, 2009
Sold by
Mendoza Magdalena L
Bought by
Indymac Federal Bank Fsb
Purchase Details
Closed on
Oct 23, 2004
Sold by
Perez Auturo and Mendoza Magdalena L
Bought by
Mendoza Magdalena L
Home Financials for this Owner
Home Financials are based on the most recent Mortgage that was taken out on this home.
Original Mortgage
$404,000
Interest Rate
1%
Mortgage Type
Negative Amortization
Purchase Details
Closed on
Jul 24, 2001
Sold by
Soto Jose and Soto Juan
Bought by
Perez Arturo and Perez Magdalena
Home Financials for this Owner
Home Financials are based on the most recent Mortgage that was taken out on this home.
Original Mortgage
$50,000
Interest Rate
7.19%
Mortgage Type
Unknown
Purchase Details
Closed on
May 20, 2000
Sold by
Jose Soto and Juan Soto
Bought by
Soto Jose and Soto Juan
Home Financials for this Owner
Home Financials are based on the most recent Mortgage that was taken out on this home.
Original Mortgage
$281,431
Interest Rate
8.08%
Purchase Details
Closed on
Mar 31, 1998
Sold by
Zavala Sulma
Bought by
Soto Jose
Home Financials for this Owner
Home Financials are based on the most recent Mortgage that was taken out on this home.
Original Mortgage
$260,100
Interest Rate
9.99%
Purchase Details
Closed on
Mar 25, 1998
Sold by
Mouw Kenneth W and Mouw Nancy A
Bought by
Soto Jose and Soto Juan
Home Financials for this Owner
Home Financials are based on the most recent Mortgage that was taken out on this home.
Original Mortgage
$260,100
Interest Rate
9.99%
Purchase Details
Closed on
Jul 6, 1994
Sold by
Mouw Kenneth W and Mouw Nancy A
Bought by
Mouw Kenneth W and Mouw Nancy A
Create a Home Valuation Report for This Property
The Home Valuation Report is an in-depth analysis detailing your home's value as well as a comparison with similar homes in the area
Home Values in the Area
Average Home Value in this Area
Purchase History
| Date | Buyer | Sale Price | Title Company |
|---|---|---|---|
| Tran Thang H | -- | Old Republic Title Company | |
| Truong Song Thi | $470,000 | Fidelity National Title Co | |
| Truong Songthi T | -- | Fidelity National Title Co | |
| Indymac Federal Bank Fsb | $432,483 | None Available | |
| Mendoza Magdalena L | -- | Ticor Title Company | |
| Perez Arturo | $500,000 | New Century Title | |
| Soto Jose | -- | Fidelity National Title Ins | |
| Soto Jose | -- | Financial Title Company | |
| Soto Jose | $289,000 | Financial Title Company | |
| Mouw Kenneth W | -- | -- |
Source: Public Records
Mortgage History
| Date | Status | Borrower | Loan Amount |
|---|---|---|---|
| Open | Tran Thang H | $329,000 | |
| Closed | Truong Song Thi | $352,500 | |
| Previous Owner | Mendoza Magdalena L | $404,000 | |
| Previous Owner | Perez Arturo | $50,000 | |
| Previous Owner | Perez Arturo | $400,000 | |
| Previous Owner | Soto Jose | $281,431 | |
| Previous Owner | Soto Jose | $260,100 |
Source: Public Records
Tax History Compared to Growth
Tax History
| Year | Tax Paid | Tax Assessment Tax Assessment Total Assessment is a certain percentage of the fair market value that is determined by local assessors to be the total taxable value of land and additions on the property. | Land | Improvement |
|---|---|---|---|---|
| 2025 | $9,053 | $606,668 | $464,688 | $141,980 |
| 2024 | $9,053 | $594,774 | $455,577 | $139,197 |
| 2023 | $8,882 | $583,113 | $446,645 | $136,468 |
| 2022 | $8,844 | $571,681 | $437,888 | $133,793 |
| 2021 | $8,550 | $560,472 | $429,302 | $131,170 |
| 2020 | $8,281 | $554,727 | $424,901 | $129,826 |
| 2019 | $7,965 | $543,851 | $416,570 | $127,281 |
| 2018 | $7,849 | $533,188 | $408,402 | $124,786 |
| 2017 | $7,890 | $522,735 | $400,395 | $122,340 |
| 2016 | $7,563 | $512,487 | $392,545 | $119,942 |
| 2015 | $7,473 | $504,790 | $386,649 | $118,141 |
| 2014 | $6,815 | $494,903 | $379,076 | $115,827 |
Source: Public Records
Map
Nearby Homes
- 1898 Anne Marie Ct
- 1982 Plaza Montez
- 2075 Lakewood Dr
- 2625 Autumnvale Dr
- 3108 Kermath Dr
- 2158 Capitol Park Ct
- 2200 Beech Cir
- 2559 Alveswood Cir
- 3139 Laneview Dr
- 1756 Valhalla Ct
- 1693 Peachwood Dr
- 2844 Parkrow Ln
- 1455 Cherry Cir
- 2085 Ashwood Ln
- 1928 N Star Place
- 861 Garden St
- 3093 Melchester Dr
- 1710 Clear Lake Ave
- 813 Garden St
- 1452 Nightshade Rd Unit 40
- 1978 Camargo Dr
- 1976 Camargo Dr
- 2918 Via Encinitas
- 1972 Camargo Dr
- 2907 Via Encinitas
- 2891 Via Encinitas
- 2895 Via Encinitas
- 1968 Camargo Dr
- 2887 Via Encinitas
- 2899 Via Encinitas
- 2921 Via Encinitas
- 2883 Via Encinitas
- 2874 Via Encinitas
- 1975 Camargo Dr
- 1971 Camargo Dr
- 2929 Via Encinitas
- 2054 Amberwood Ct
- 2879 Via Encinitas
- 1965 Camargo Dr
- 1960 Camargo Dr