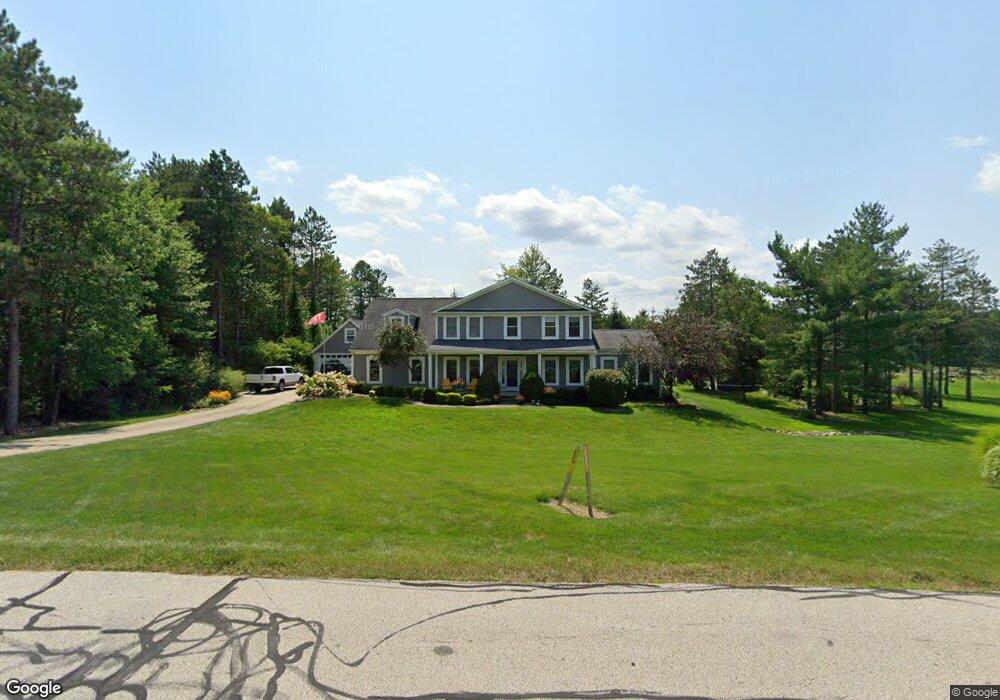
2896 Pine Trails Cir Hudson, OH 44236
Estimated Value: $495,000 - $614,000
3
Beds
3
Baths
2,694
Sq Ft
$215/Sq Ft
Est. Value
About This Home
This home is located at 2896 Pine Trails Cir, Hudson, OH 44236 and is currently estimated at $578,500, approximately $214 per square foot. 2896 Pine Trails Cir is a home located in Summit County with nearby schools including Ellsworth Hill Elementary School, East Woods Intermediate School, and Hudson Middle School.
Ownership History
Date
Name
Owned For
Owner Type
Purchase Details
Closed on
Apr 22, 2020
Sold by
Unknown
Bought by
Stotz Kristopher J and Stotz Betsy L
Current Estimated Value
Purchase Details
Closed on
Mar 7, 2020
Sold by
Unknown and Stotz Betsy L
Bought by
Stotz Kristopher J and Stotz Betsy L
Purchase Details
Closed on
Mar 15, 2014
Sold by
Stor Kristopher J and Stor Betsy
Bought by
Stor Kristopher J and Stor Betsy
Purchase Details
Closed on
Aug 17, 2012
Sold by
Fannie Mae and Federal National Mortgage Association
Bought by
Cross Christopher L and Cross Elizabeth A
Home Financials for this Owner
Home Financials are based on the most recent Mortgage that was taken out on this home.
Original Mortgage
$276,398
Interest Rate
3.6%
Mortgage Type
FHA
Create a Home Valuation Report for This Property
The Home Valuation Report is an in-depth analysis detailing your home's value as well as a comparison with similar homes in the area
Home Values in the Area
Average Home Value in this Area
Purchase History
| Date | Buyer | Sale Price | Title Company |
|---|---|---|---|
| Stotz Kristopher J | -- | -- | |
| Stotz Kristopher J | -- | None Listed On Document | |
| Stotz Kristopher J | -- | None Available | |
| Stotz Kristopher J | -- | None Listed On Document | |
| Stor Kristopher J | -- | None Available | |
| Cross Christopher L | -- | -- | |
| Cross Christopher L | -- | -- |
Source: Public Records
Mortgage History
| Date | Status | Borrower | Loan Amount |
|---|---|---|---|
| Previous Owner | Cross Christopher L | $276,398 |
Source: Public Records
Tax History Compared to Growth
Tax History
| Year | Tax Paid | Tax Assessment Tax Assessment Total Assessment is a certain percentage of the fair market value that is determined by local assessors to be the total taxable value of land and additions on the property. | Land | Improvement |
|---|---|---|---|---|
| 2025 | $9,081 | $178,024 | $32,039 | $145,985 |
| 2024 | $9,081 | $178,024 | $32,039 | $145,985 |
| 2023 | $9,081 | $178,024 | $32,039 | $145,985 |
| 2022 | $8,205 | $143,455 | $25,631 | $117,824 |
| 2021 | $8,219 | $143,455 | $25,631 | $117,824 |
| 2020 | $8,074 | $143,450 | $25,630 | $117,820 |
| 2019 | $8,608 | $141,670 | $25,630 | $116,040 |
| 2018 | $8,578 | $141,670 | $25,630 | $116,040 |
| 2017 | $7,502 | $141,670 | $25,630 | $116,040 |
| 2016 | $7,555 | $120,240 | $25,630 | $94,610 |
| 2015 | $7,502 | $120,240 | $25,630 | $94,610 |
| 2014 | $7,127 | $114,150 | $25,630 | $88,520 |
Source: Public Records
Map
Nearby Homes
- 7753 Red Fox Trail
- 2664 Easthaven Dr
- 8028 Megan Meadow Dr
- 7687 Ravenna Rd
- 7603 Red Fox Trail
- 3425 Eryn Place
- 2346 Danbury Ln
- 7205 Dillman Dr
- 2142 Kirtland Place
- 2047 Fairway Blvd Unit 22A
- 2219 Fairway Blvd Unit 4E
- 7511 Herrick Park Dr
- 2061 Garden Ln
- 2221 Kate Ct
- 2380 Victoria Pkwy
- 558 Frost Rd
- 10016 Brushwood Dr
- 10131 Buckhorn Trail
- 749 Antler Trail
- 805 Hunter Ridge Dr
- 2908 Pine Trails Cir
- 2884 Pine Trails Cir
- 2881 Pine Trails Cir
- 2905 Pine Trails Cir
- 3033 Pine Trails Cir
- 2919 Pine Trails Cir
- 2876 Pine Trails Cir
- 2873 Pine Trails Cir
- 2927 Pine Trails Cir
- 8007 Stow Rd
- 3013 Pine Trails Cir
- 2933 Pine Trails Cir
- 7951 Chamberlin Ct
- 3014 Pine Trails Cir
- 8093 Stow Rd
- 7933 Chamberlin Ct
- 2934 Pine Trails Cir
- 7987 Stow Rd
- 7948 Chamberlin Ct
- 8105 Stow Rd