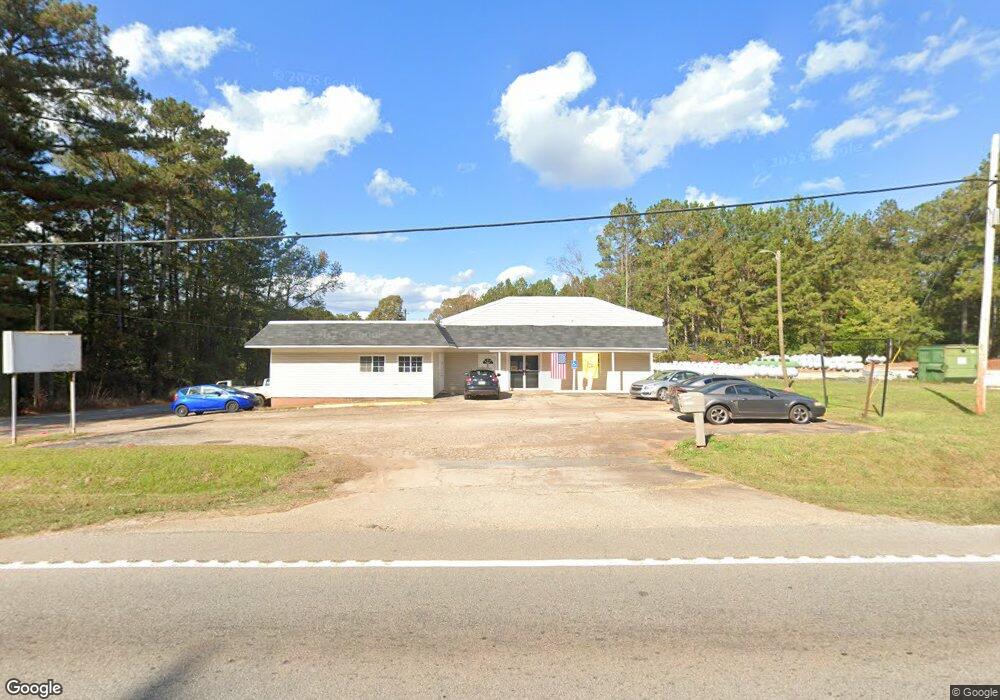
2898 W Point Rd La Grange, GA 30240
Estimated Value: $233,110
--
Bed
1
Bath
4,088
Sq Ft
$57/Sq Ft
Est. Value
About This Home
This home is located at 2898 W Point Rd, La Grange, GA 30240 and is currently estimated at $233,110, approximately $57 per square foot. 2898 W Point Rd is a home located in Troup County with nearby schools including Berta Weathersbee Elementary School, Long Cane Elementary School, and Whitesville Road Elementary School.
Ownership History
Date
Name
Owned For
Owner Type
Purchase Details
Closed on
Aug 24, 2022
Sold by
Barrington John
Bought by
Bates Ruben
Current Estimated Value
Purchase Details
Closed on
Nov 3, 1997
Sold by
Ruth Horace and Ruth Allen
Bought by
Schmidt Enterprises Inc
Purchase Details
Closed on
Dec 1, 1987
Sold by
George
Bought by
Ruth Horace and Ruth Allen
Purchase Details
Closed on
Jan 1, 1973
Bought by
George
Purchase Details
Closed on
Jan 1, 1967
Sold by
Frank R Young
Create a Home Valuation Report for This Property
The Home Valuation Report is an in-depth analysis detailing your home's value as well as a comparison with similar homes in the area
Home Values in the Area
Average Home Value in this Area
Purchase History
| Date | Buyer | Sale Price | Title Company |
|---|---|---|---|
| Bates Ruben | $165,000 | -- | |
| Schmidt Enterprises Inc | -- | -- | |
| Ruth Horace | -- | -- | |
| George | $9,000 | -- | |
| -- | -- | -- |
Source: Public Records
Tax History Compared to Growth
Tax History
| Year | Tax Paid | Tax Assessment Tax Assessment Total Assessment is a certain percentage of the fair market value that is determined by local assessors to be the total taxable value of land and additions on the property. | Land | Improvement |
|---|---|---|---|---|
| 2024 | $2,400 | $110,600 | $4,720 | $105,880 |
| 2023 | $1,800 | $107,800 | $4,720 | $103,080 |
| 2022 | $3,033 | $108,680 | $5,600 | $103,080 |
| 2021 | $2,278 | $75,520 | $3,680 | $71,840 |
| 2020 | $2,278 | $75,520 | $3,680 | $71,840 |
| 2019 | $2,209 | $73,240 | $3,680 | $69,560 |
| 2018 | $2,143 | $71,064 | $6,560 | $64,504 |
| 2017 | $2,143 | $71,064 | $6,560 | $64,504 |
| 2016 | $2,146 | $71,148 | $6,560 | $64,588 |
| 2015 | $2,149 | $71,148 | $6,560 | $64,588 |
| 2014 | $2,153 | $71,148 | $6,560 | $64,588 |
| 2013 | -- | $71,148 | $6,560 | $64,588 |
Source: Public Records
Map
Nearby Homes
- 808 S Fling Rd
- 37 Overbrook Dr
- 509 Connie Dr
- 0 Bradfield Dr Unit 10568803
- 190 Hill Rd
- 110 Hawthorne Cir
- 103 Hawthorne Cir
- 105 Hawthorne Cir
- 124 Foxdale Dr
- 61 Freeman Rd
- 22 Freeman Rd
- 100 Huntcliff Ct
- 141 Avery Dr
- 146 Whitaker Rd
- 135 Planters Ridge Dr
- 0 Unit 10514554
- 223 Pinehaven Dr
- 117 Brookwood Dr
- 141 Plymouth Dr
- LOT 4 Angela Dr
- 26 Center Rd
- 2922 West Point Rd
- 38 Center Rd
- 29 Center Rd
- 2913 W Point Rd
- 570 Fling Rd
- 2877 West Point Rd
- 556 Fling Rd
- 790 S Fling Rd
- 538 Fling Rd
- 2842 W Point Rd
- 100 West Gate Dr
- 0 Center Rd Unit 7497188
- 0 Center Rd Unit 8252934
- 0 Center Rd
- 567 Fling Rd Unit B
- 567 Fling Rd
- 567 Fling Rd Unit B
- 82 Center Rd
- 0 Westgate Dr Unit 7502500