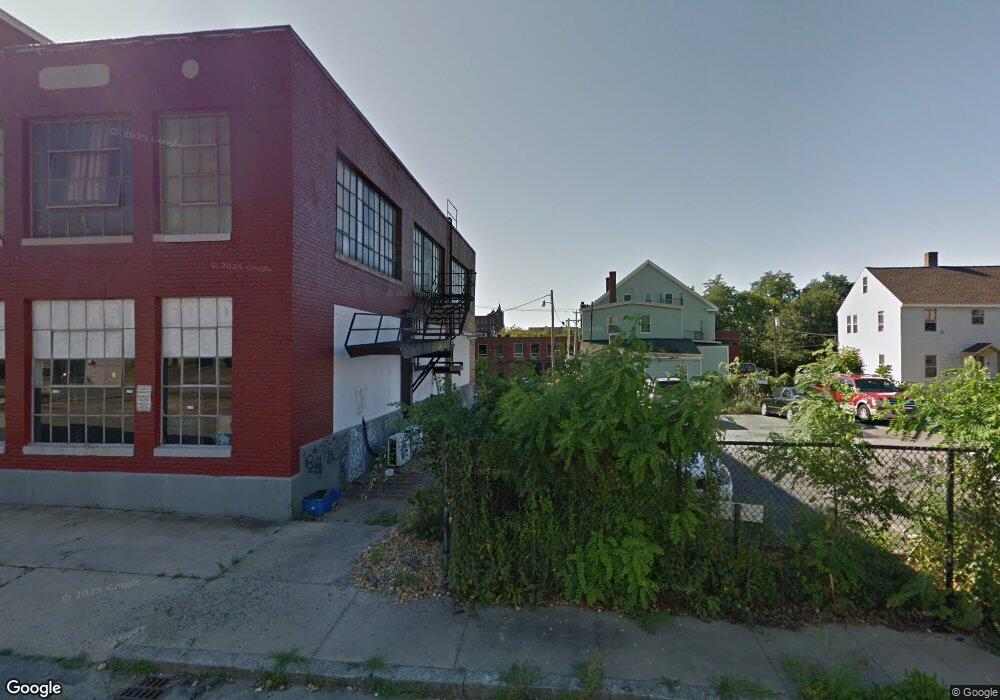
29-39 Main St Nashua, NH 03064
North End Nashua NeighborhoodEstimated Value: $3,178,208
--
Bed
--
Bath
30,090
Sq Ft
$106/Sq Ft
Est. Value
About This Home
This home is located at 29-39 Main St, Nashua, NH 03064 and is currently estimated at $3,178,208, approximately $105 per square foot. 29-39 Main St is a home located in Hillsborough County with nearby schools including Amherst Street School, Pennichuck Middle School, and Nashua High School North.
Ownership History
Date
Name
Owned For
Owner Type
Purchase Details
Closed on
Dec 18, 2012
Sold by
33 Main Street Rt and Cohen
Bought by
Whiting Building Llc
Current Estimated Value
Home Financials for this Owner
Home Financials are based on the most recent Mortgage that was taken out on this home.
Original Mortgage
$250,000
Outstanding Balance
$172,755
Interest Rate
3.39%
Mortgage Type
Commercial
Estimated Equity
$3,005,453
Create a Home Valuation Report for This Property
The Home Valuation Report is an in-depth analysis detailing your home's value as well as a comparison with similar homes in the area
Home Values in the Area
Average Home Value in this Area
Purchase History
| Date | Buyer | Sale Price | Title Company |
|---|---|---|---|
| Whiting Building Llc | $1,400,000 | -- |
Source: Public Records
Mortgage History
| Date | Status | Borrower | Loan Amount |
|---|---|---|---|
| Open | Whiting Building Llc | $250,000 |
Source: Public Records
Tax History Compared to Growth
Tax History
| Year | Tax Paid | Tax Assessment Tax Assessment Total Assessment is a certain percentage of the fair market value that is determined by local assessors to be the total taxable value of land and additions on the property. | Land | Improvement |
|---|---|---|---|---|
| 2024 | $28,116 | $1,768,300 | $250,200 | $1,518,100 |
| 2023 | $29,421 | $1,613,900 | $217,700 | $1,396,200 |
| 2022 | $29,163 | $1,613,900 | $217,700 | $1,396,200 |
| 2021 | $29,146 | $1,255,200 | $207,200 | $1,048,000 |
| 2020 | $28,380 | $1,255,200 | $207,200 | $1,048,000 |
| 2019 | $27,313 | $1,255,200 | $207,200 | $1,048,000 |
| 2018 | $29,837 | $1,255,200 | $207,200 | $1,048,000 |
| 2017 | $29,426 | $1,141,000 | $228,500 | $912,500 |
| 2016 | $28,174 | $1,123,800 | $228,500 | $895,300 |
| 2015 | $27,567 | $1,123,800 | $228,500 | $895,300 |
| 2014 | $27,027 | $1,123,800 | $228,500 | $895,300 |
Source: Public Records
Map
Nearby Homes
- 52 Main St Unit 402
- 11 Charles St
- 38 Central St
- 0 Baldwin St
- 5 Mulberry St
- 36-38 Courtland St
- 30 Ledge St
- 155 Tolles St
- 7 Bitirnas St Unit U7
- 8 Buck St Unit 10
- 4 Reservoir St
- 71 Concord St
- 61 Manchester St
- 18 Harbor Ave Unit 208
- 13 Sapphire Ln
- 15 Atherton Ave
- 19 Atherton Ave
- 22 Wilder St
- 24 E Otterson St
- 4 Badger St
- 33 Main St
- 29 Main St
- 25 Main St
- 23 Main St
- 23-27 Main St
- 23 Main St Unit A
- 17 Thayer Ct Unit 19
- 21 Main St
- 7 Thayer Ct
- 53 Main St
- 32 Railroad Square
- 9 9th St
- 13-15 Thayer Ct
- 13 Thayer Ct Unit 15
- 6 Main St
- 12 Fletcher St Unit 14
- 79 Fletcher St
- 7 Fletcher St
- 18 Fletcher St Unit 130
- 11 Fletcher St Unit 13