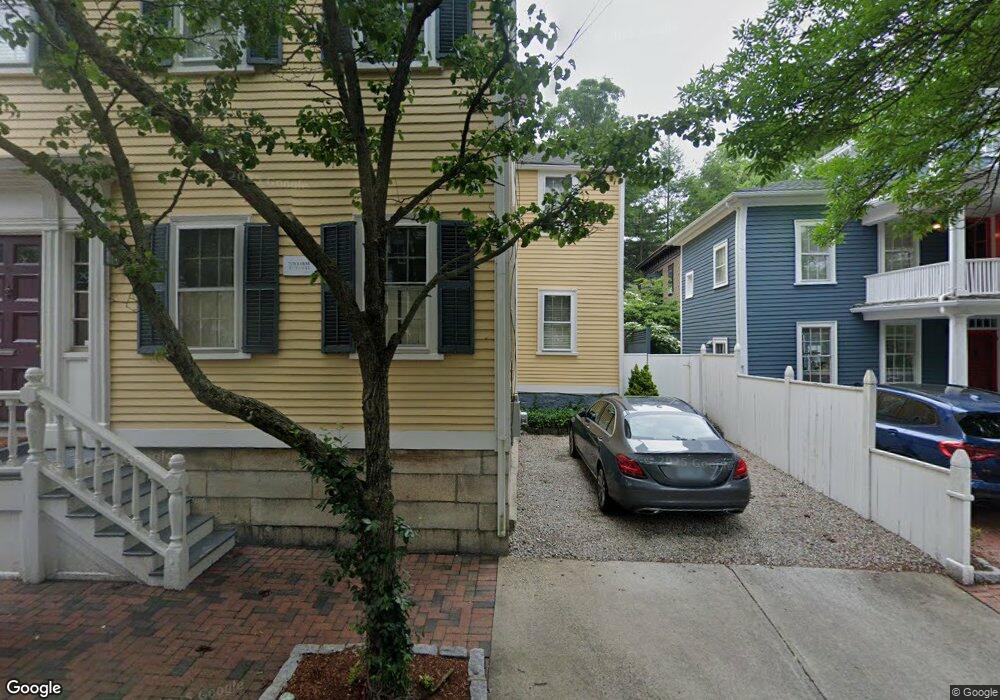
29 Arnold St Unit 1 Providence, RI 02906
Fox Point NeighborhoodEstimated Value: $972,000 - $1,295,000
3
Beds
3
Baths
2,707
Sq Ft
$416/Sq Ft
Est. Value
About This Home
This home is located at 29 Arnold St Unit 1, Providence, RI 02906 and is currently estimated at $1,125,317, approximately $415 per square foot. 29 Arnold St Unit 1 is a home located in Providence County with nearby schools including Asa Messer Elementary School, Charles N. Fortes Elementary School, and Robert L. Bailey IV Elementary.
Ownership History
Date
Name
Owned For
Owner Type
Purchase Details
Closed on
Oct 26, 2012
Sold by
Constance G Raymond T
Bought by
Madaio Gina M
Current Estimated Value
Home Financials for this Owner
Home Financials are based on the most recent Mortgage that was taken out on this home.
Original Mortgage
$376,000
Outstanding Balance
$260,981
Interest Rate
3.56%
Estimated Equity
$864,337
Purchase Details
Closed on
Oct 30, 2000
Sold by
Macfadyen William L and Macfadyen Suzanne
Bought by
Denton Geoffrey H
Purchase Details
Closed on
Aug 12, 1998
Sold by
Fingerman David A
Bought by
Macfadyen William L and Macfayden Suzanne
Purchase Details
Closed on
Apr 27, 1995
Sold by
Mason William T and Mason Cynthia
Bought by
Fingerman David A
Create a Home Valuation Report for This Property
The Home Valuation Report is an in-depth analysis detailing your home's value as well as a comparison with similar homes in the area
Home Values in the Area
Average Home Value in this Area
Purchase History
| Date | Buyer | Sale Price | Title Company |
|---|---|---|---|
| Madaio Gina M | $470,000 | -- | |
| Denton Geoffrey H | $445,000 | -- | |
| Macfadyen William L | $285,000 | -- | |
| Fingerman David A | $250,000 | -- |
Source: Public Records
Mortgage History
| Date | Status | Borrower | Loan Amount |
|---|---|---|---|
| Open | Madaio Gina M | $376,000 | |
| Previous Owner | Fingerman David A | $143,000 | |
| Previous Owner | Fingerman David A | $200,000 | |
| Previous Owner | Fingerman David A | $158,306 |
Source: Public Records
Tax History Compared to Growth
Tax History
| Year | Tax Paid | Tax Assessment Tax Assessment Total Assessment is a certain percentage of the fair market value that is determined by local assessors to be the total taxable value of land and additions on the property. | Land | Improvement |
|---|---|---|---|---|
| 2025 | $7,627 | $908,000 | $535,600 | $372,400 |
| 2024 | $12,096 | $659,200 | $376,900 | $282,300 |
| 2023 | $12,096 | $659,200 | $376,900 | $282,300 |
| 2022 | $11,734 | $659,200 | $376,900 | $282,300 |
| 2021 | $12,481 | $508,200 | $266,000 | $242,200 |
| 2020 | $12,481 | $508,200 | $266,000 | $242,200 |
| 2019 | $12,481 | $508,200 | $266,000 | $242,200 |
| 2018 | $13,554 | $424,100 | $252,800 | $171,300 |
| 2017 | $13,554 | $424,100 | $252,800 | $171,300 |
| 2016 | $13,554 | $424,100 | $252,800 | $171,300 |
| 2015 | $14,862 | $449,000 | $263,800 | $185,200 |
| 2014 | $15,154 | $449,000 | $263,800 | $185,200 |
| 2013 | $15,154 | $449,000 | $263,800 | $185,200 |
Source: Public Records
Map
Nearby Homes
- 84 Transit St
- 104 Sheldon St
- 273 Wickenden St
- 323 Wickenden St
- 555 S Water St Unit 325
- 207 Williams St Unit 2
- 427 Wickenden St
- 117 Benevolent St
- 73 Trenton St
- 6 Olive St
- 96 Gano St Unit 3
- 130 Gano St
- 130 Gano St Unit A
- 670 Wickenden St
- 65 Weybosset St Unit 211
- 65 Weybosset St Unit 202
- 65 Weybosset St Unit 223
- 165 Waterman St Unit 2
- 93 Eddy St
- 63 Pitman St Unit 5